AUD/JPY: testing the resistance
Long-term
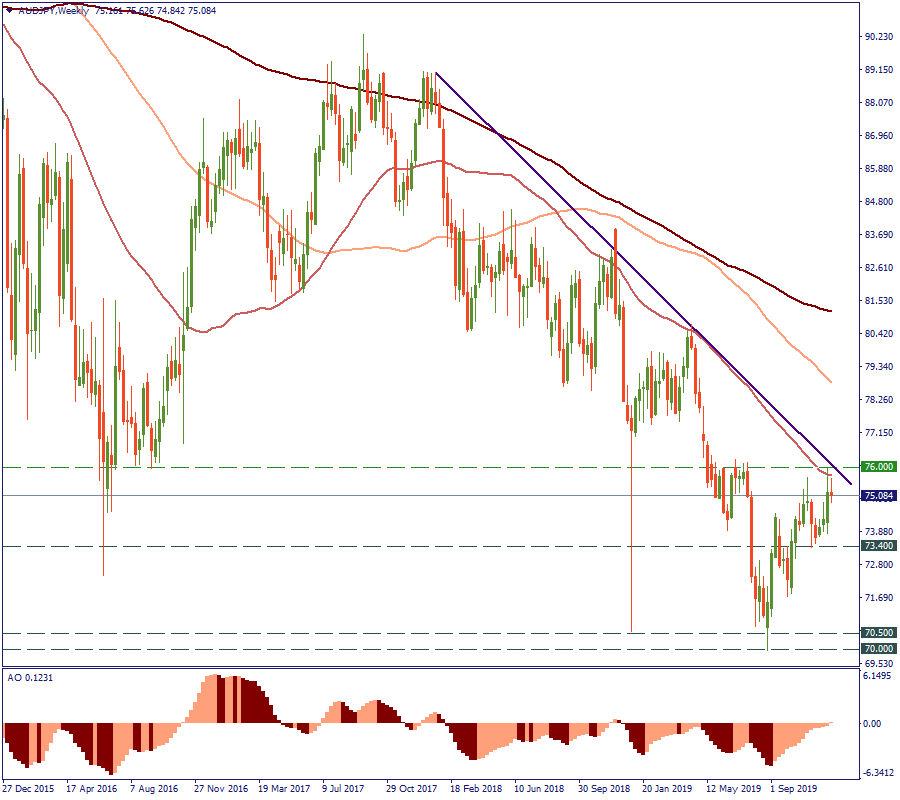
From the very beginning of 2018, the overall direction of AUD/JPY was a decline. On the weekly chart, this downtrend is visible, with the 50-week Moving Average serving as the resistance. Since then, the price has tested that resistance two times. Now, we are observing the third time. Therefore, the question is: will it be just another such time or a start of the long-term trend change.

Mid-term
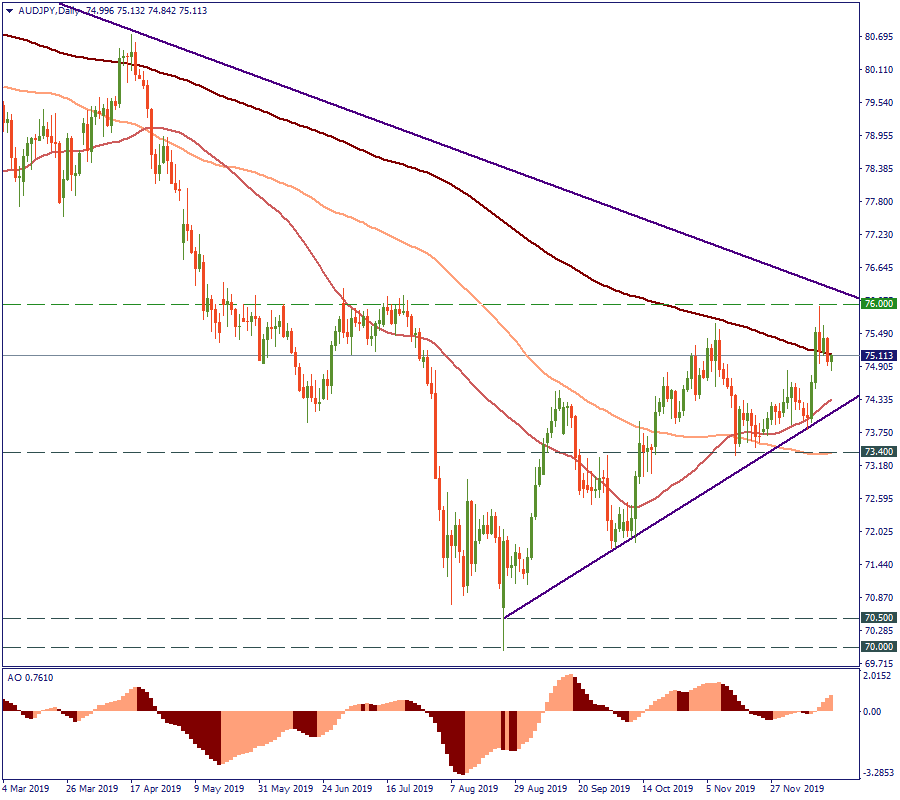
Recently, the price came close to the resistance level of 76.00, which is a 6-months high. On the daily chart, it did the same in November but then dropped. Now, as it is testing the 200-day Moving Average being already above the 50-day and 100-day MAs, it is likely to go into consolidation at the present level.
In fact, we are observing a collision of the 2-years downtrend and the 6-months uptrend. For this reason, whatever the outcome, climbing further up will be difficult, and the price will have to fight its way to actually break through the 200-day Moving Average and the resistance level of 76.00. If it does, we will see a new large trend emerging.

Short-term
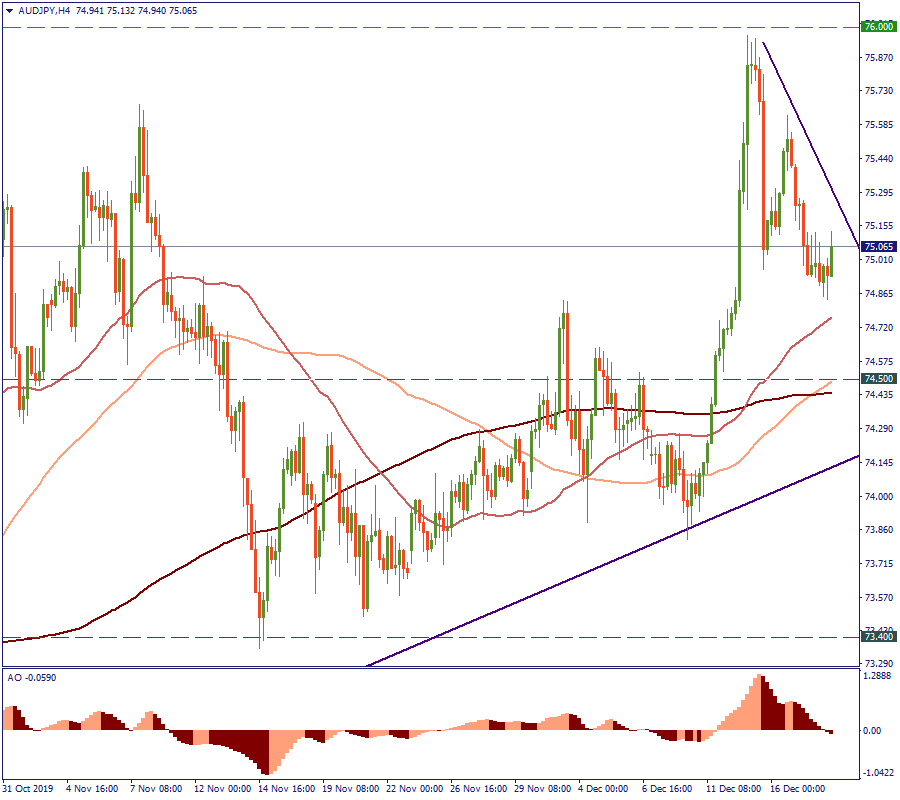
In the course of the abovementioned mid-term consolidation, the price is likely to drop to the area of 74.50. That is approximately where the local 1-week downtrend will cross the 6-months uptrend and the 200-period and 100-period MAs. If the price drops below the mentioned Moving Averages, it should be for a relatively short period of time.
The local downtrend is also confirmed by the reading of the Awesome Oscillator, which just crossed the zero-line downwards after two descending consecutive peaks.
Overall
In the short-term, the price shows signs of continuing the downward trend. In the mid-term, we are likely to see consolidation. In the long-term – we have to wait to see the overall trend being broken or continued further.
To understand the factors behind the AUD/JPY price movements, read the news and examine the fundamentals for this currency pair.
