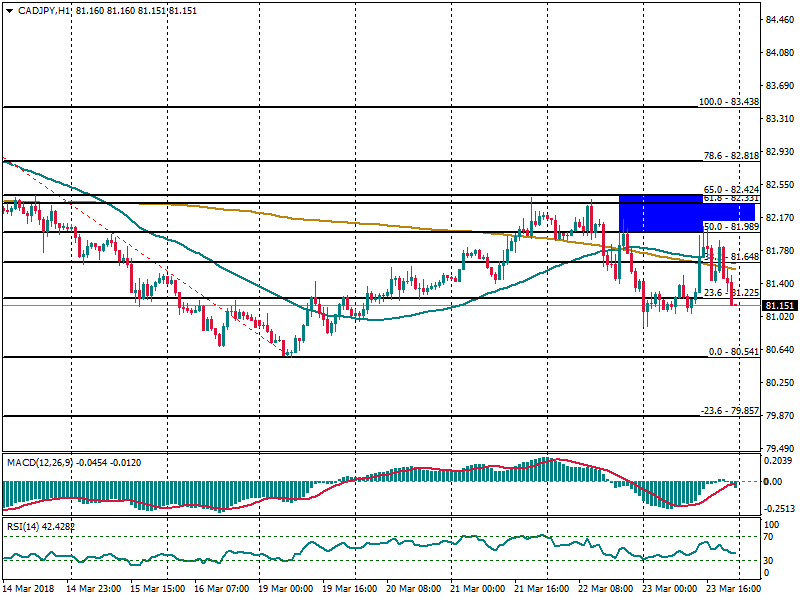
CAD/JPY strengthening the bearish bias below the 200 SMA
CAD/JPY has been finding strong resistance at the Fibonacci level of 50% at 81.98 following a buying wave seen since March 19th session. The 200 SMA at H1 chart is helping to provide dynamic resistance so far and the pair didn’t succeed to post fresh highs above the 65% Fibonacci level and that’s why we would like to see a bearish continuation towards the -23.6% Fibonacci zone at 79.85.
RSI indicator remains in the negative territory, favoring to the bearish bias.
