EUR/USD: reading technical levels
All markets experience substantial volatility, the most popular currency pair is no exception. EUR/USD reversed sharply down this week after almost reaching the 1.15 mark.
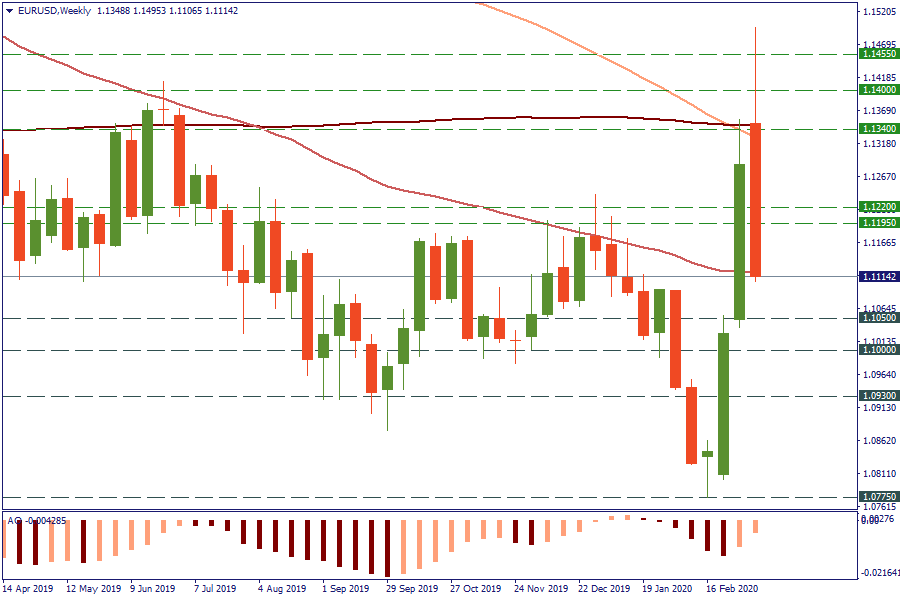
As you can see from the W1 chart, EUR/USD ran into resistance of the 100- and 200-week MAs at 1.1340. Notice that the 100-week MA went below the 200 line – that’s a bearish development. Currently the pair’s testing the 50-week Moving Average in the 1.1120 zone.

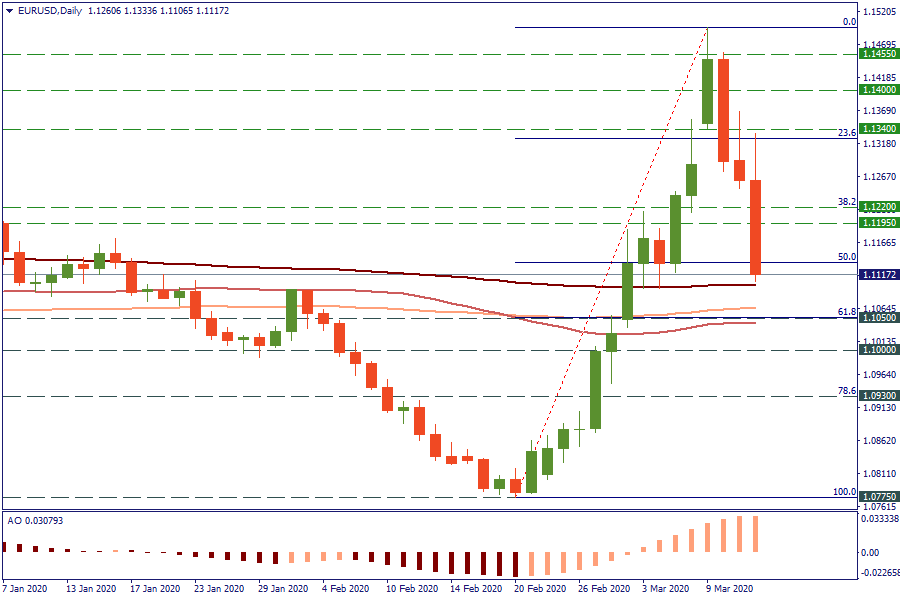
On the D1, the price is getting close to the horizontal daily MAs. These lines may provide some support. If the euro manages to stay above 1.1100, its attempts to recover will meet resistance at 1.1220 ahead of 1.1300. At the same time, Fibonacci tool shows that the price has retraced more than 50% of the February-March advance to the downside. The next Fibonacci targets to watch on the downside lie at 1.1050 (61.8% Fibo) and 1.0930 (78.6%).
