EUR/USD: update for a trade
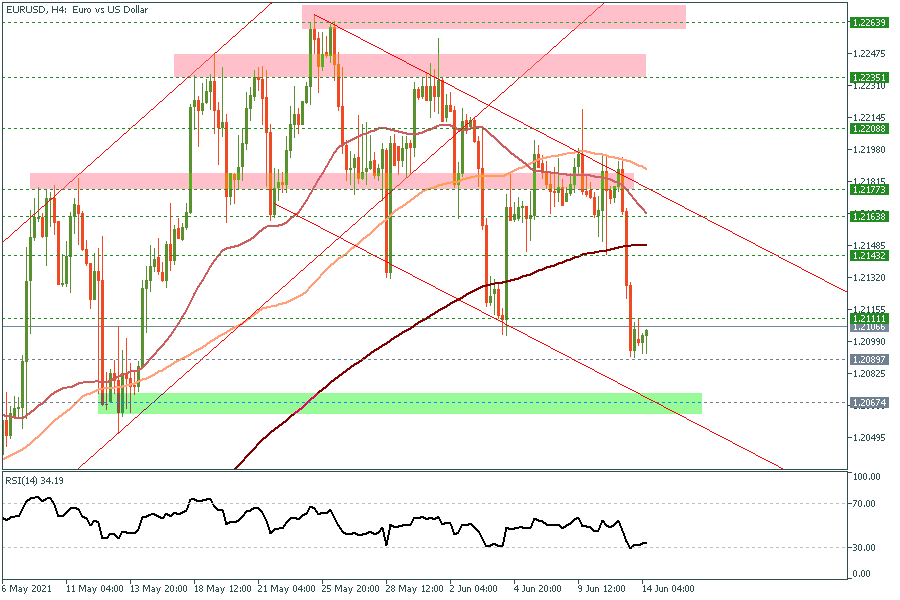
4H Chart

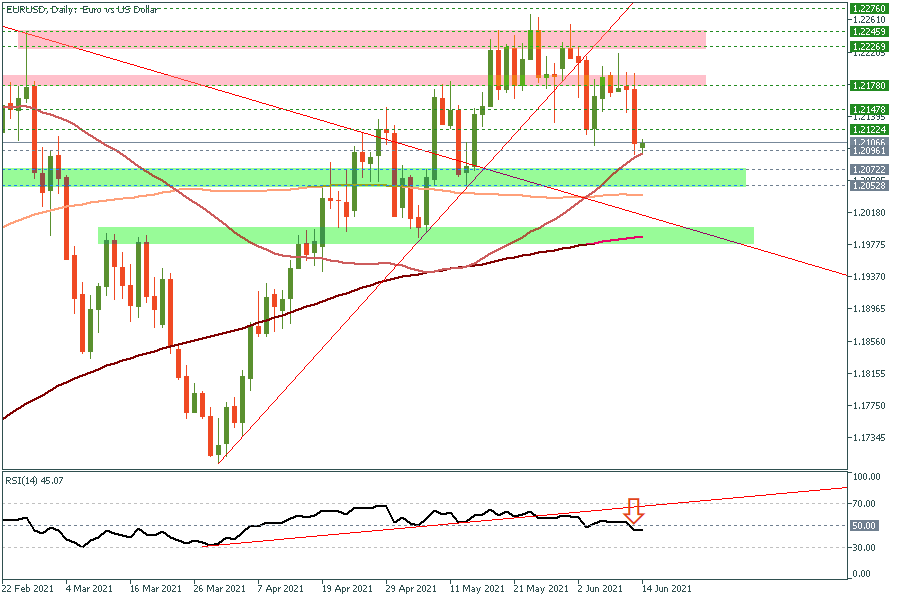
Daily Chart

EUR/USD declined on Friday reaching as low as 1.2093, while our short positions from 1.2180 and 1.2205 are now in profit with over +200 pips combined. The technical indicators are clearly bearish, which confirms the short-term retracement outlook. In the meantime, 1.2090 should be watched very carefully as it represents its 50-day MA, while a breakthrough that support level would clear the way for further declines ahead, possibly towards 1.2042 which represents its 200-day MA. On the upside view, any rally is likely to be capped below 1.22 and if you missed our entry last week, this week the selling zone stands between 1.2131 and 1.2143.
| S3 | S2 | S1 | Pivot | R1 | R2 | R3 |
| 1.1932 | 1.2032 | 1.2070 | 1.2132 | 1.2170 | 1.2232 | 1.2332 |