GBP/USD: "Double Bottom" pattern
Read the article on FBS website
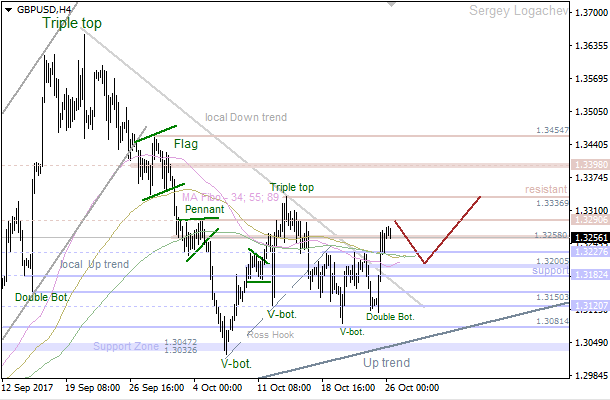
There's a "Double Bottom" pattern, so the price is rising. The 34 Moving Average is likely going to act as support in the short term. If a pullback from this line happens little later on, there'll be an option to have a bullish price movement towards the next resistance at 1.3336 - 1.3398.
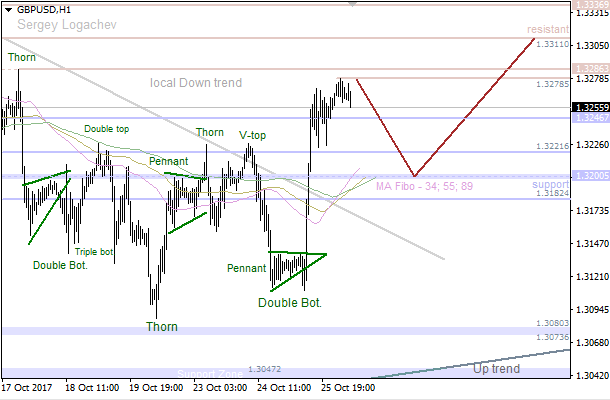
The last "Pennant" pattern has been transformed into a "Double Bottom", which led to the current bullish rally. Finally, the price found resistance at 1.3286, so we could have a local downward correction during the day. The main target for bears is the closest support at 1.3221 - 1.3200. This area could be a departure point for another upward price movement.