TRADE IDEA: Technical Breakdown of Top Cryptos
BTCUSD
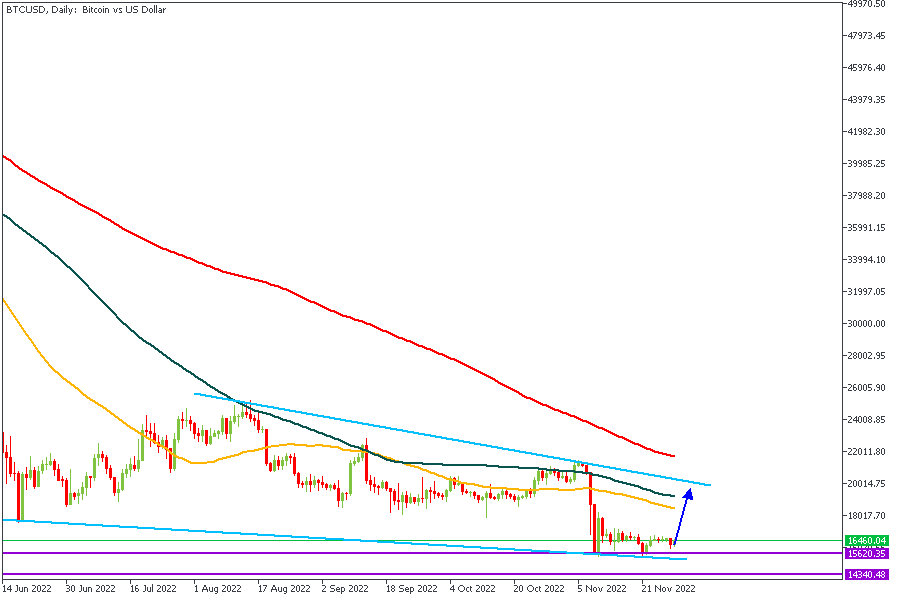
Let's start off with a look at the Daily timeframe on Bitcoin. We currently see price reacting to the rally-base-rally demand zone between the 15,600 - 14,300 price area. Price also seems to have found support off the trendline support as marked in the image above. Interestingly, this means the overall bias on BTCUSD is Bullish. However, we will take a closer look at the lower timeframes to determine whether or not price has begun yielding in that direction.
H4 Timeframe

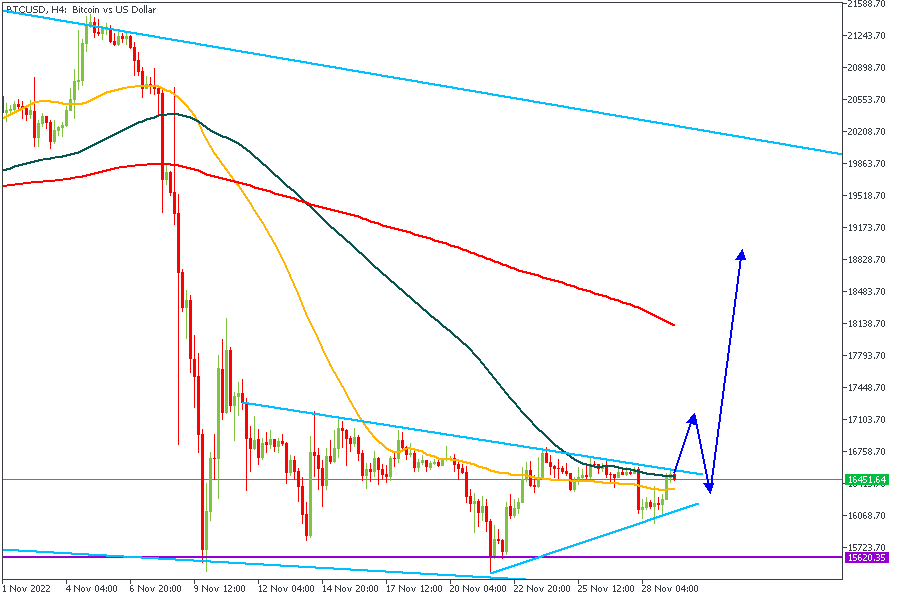
The 4-Hour timeframe poses an interesting scenario - a wedge inside the daily timeframe's channel. As a result, we will be expecting a breakout and retest to confirm the bullish bias with a price target between $18,500 and $20,000.
ETHUSD

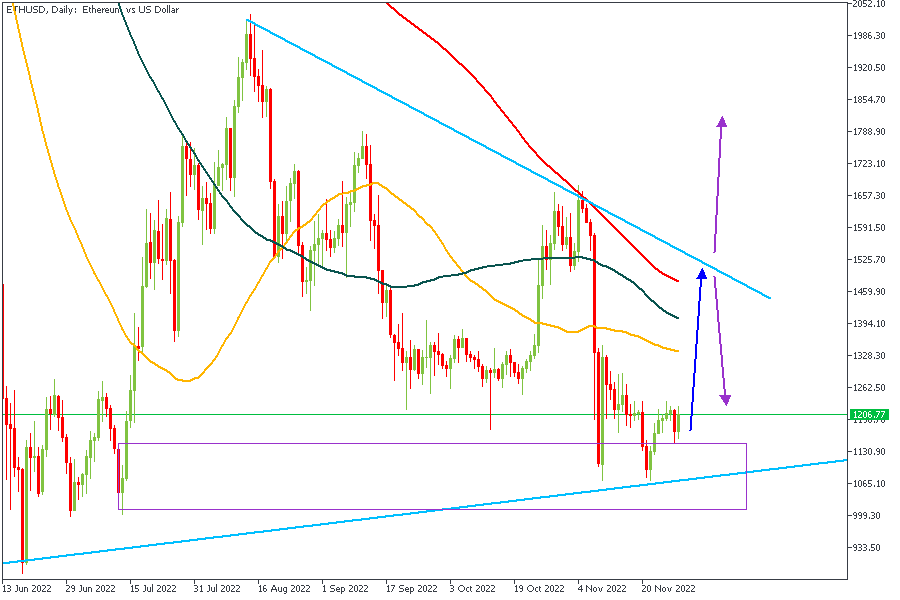
The trendline support on the Daily timeframe as seen above spans all the way from February 2020 and has just recently been tested for a third time. There is also a wide drop-base-rally demand zone within the area (the purple zone). The blue arrow represents primary bias whilst the purple arrows are secondary targets. Let's dive a bit deeper into the lower timeframe.
The 4-Hour Timeframe

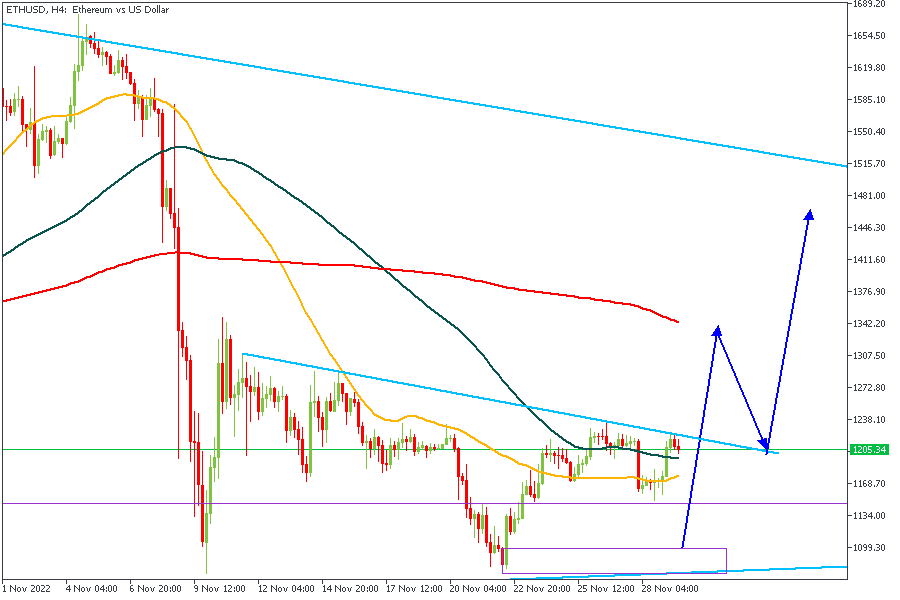
The 4-Hour timeframe shows price reacting to a resistance trendline. This means that despite the overall trend being bullish, price may tend to slip lower into the marked demand zone before actually executing the bullish move.
CONCLUSION
The views above are solely based on Technical Analysis techniques using my personal Smart Money approach. Hence, it is important to understand that the trading of CFDs comes at a risk; if not properly managed, you may lose all of your trading capital. To avoid costly mistakes while you look to trade these opportunities, be sure to do your own due diligence and manage your risk appropriately.
Log into your dashboard or create an account here to get started.