US Dollar: A Dump or a Correction?
After completing a substantial 4-week bullish rally, the US dollar closed last week with a big bearish candle, which has led to a 2.63% decline in US Dollar prices. The million-dollar question on traders' and investors' minds: is this the start of a US dollar dump or just a correction? While we await the CPI (Consumer Price Index) and Inflation Rate (YoY) release later today, the technical standpoint indicates that the recent bearish move is mostly just a retest of the 20-year highs. My bias is confirmed further by the presence of the 50-day Moving Average as an added confluence.
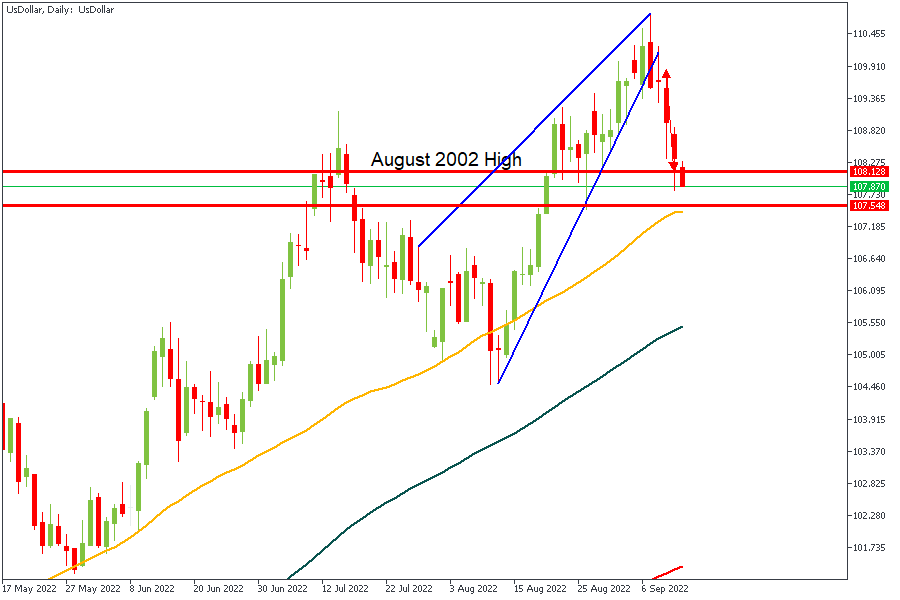
GBPUSD
GBPUSD is currently heading towards the Daily Resistance zone between 1.17615 and 1.18346. There's also a possibility of the price bouncing off the 50-day Moving Average to continue the bearish trend, provided the US dollar regains its strength.
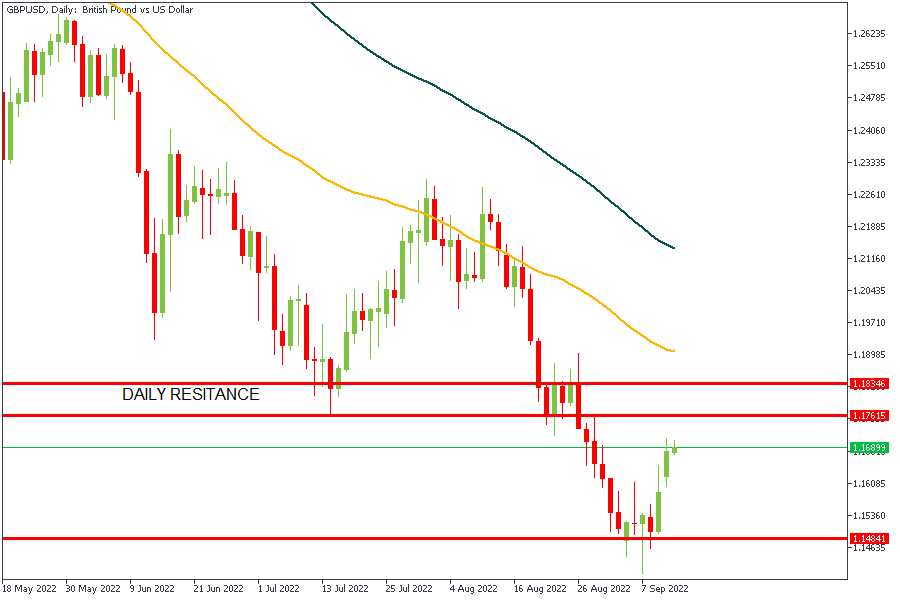
EURUSD
The retest of the upper trendline resistance on EURUSD coincides with the Fibonacci golden level and the 50-day moving average as confluences. It is pretty safe to expect a continuation of the initial bearish trend.
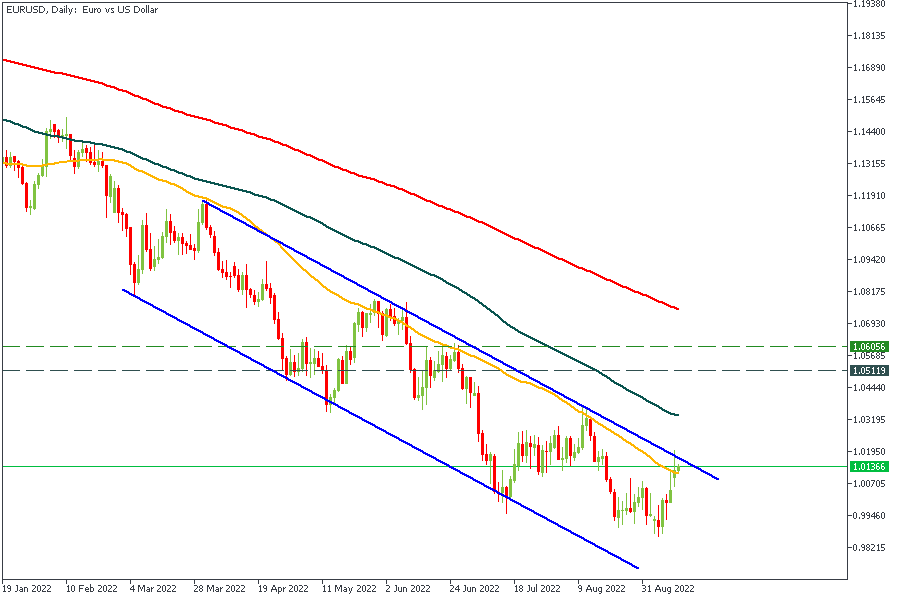
USDCHF
As you can see from the USDCHF analysis below, the price has reached the Daily Pivot zone between 0.95099 and 0.94793. There is also a confluence of trendline support and the 200-day Moving Average serving as confirmations for the resumption of the bullish trend.
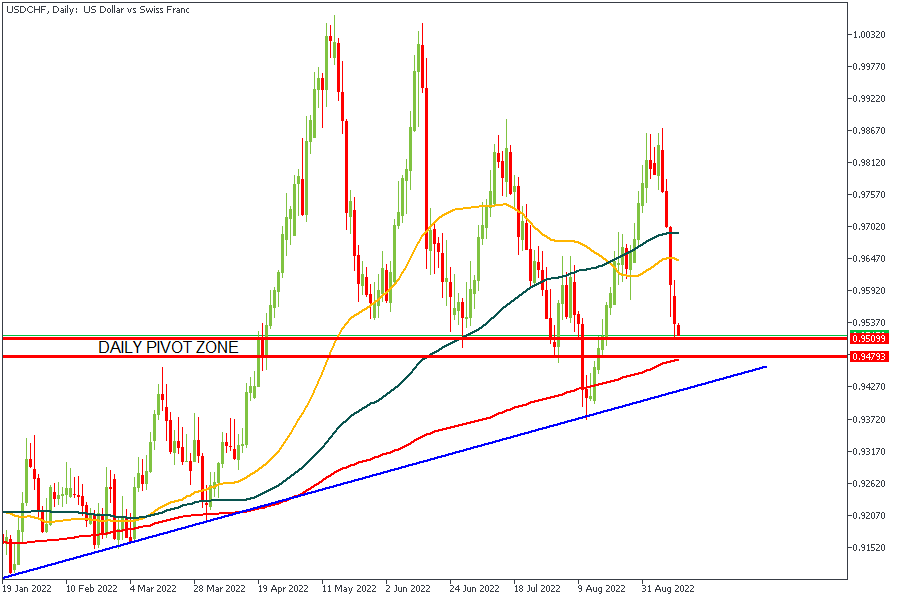
NZDUSD
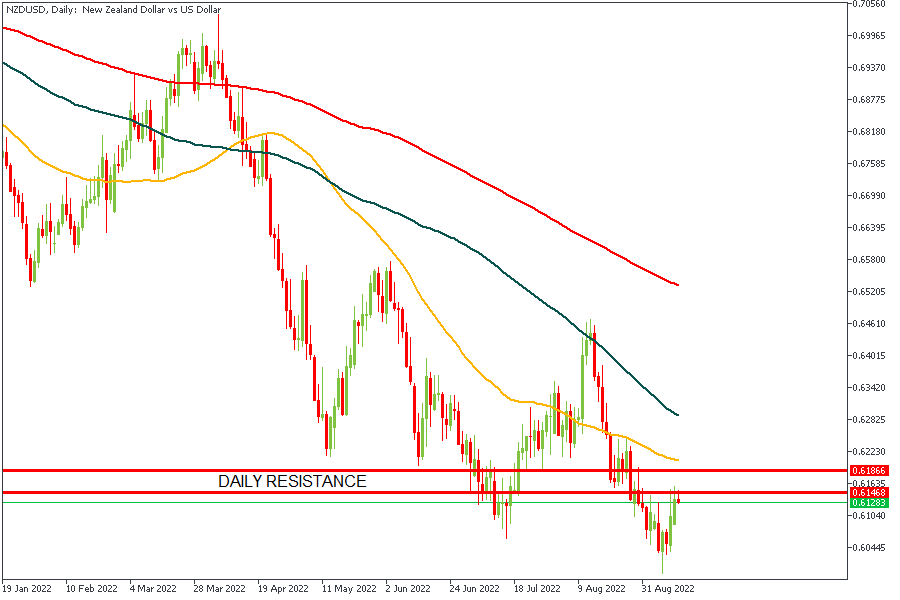
With the NZDUSD daily resistance zone at 0.61468 and 0.61866, there's a big chance that the bearish trend will regain momentum. The 50day MovingAverage also acts as a possible resistance level for the price to react from.
What Next?
You can trade these and many other leveraged currency pairs on our platform by following these simple steps:
1. Create your new trading account or log in if you already have one.
2. Search for the currency you want to trade and carefully analyze it.
3. Manage your risk properly by calculating your position size, stop and limit levels using our tool.
4. Execute your trade.