USD/CAD: bears are trying to win
Trade idea
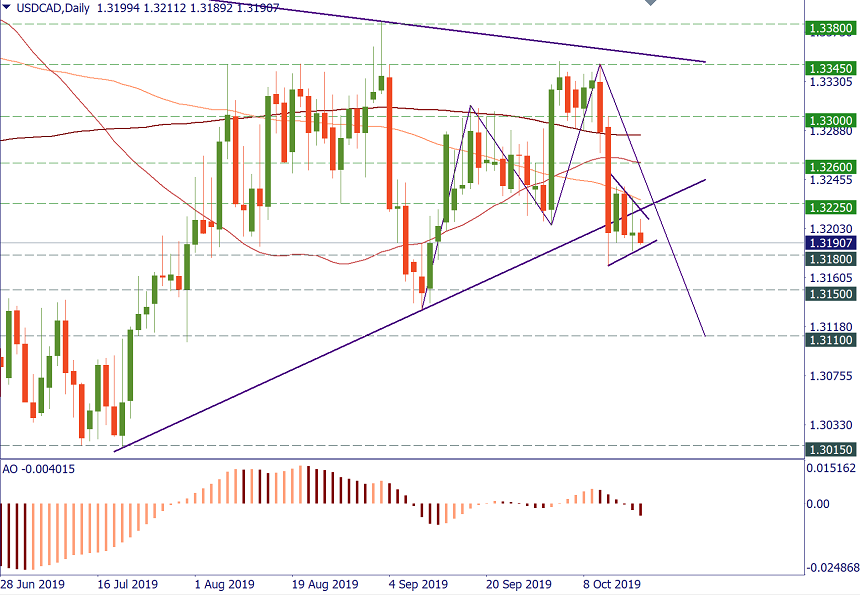
SELL 1.3180; TP1 1.3150; TP2 1.3125; SL 1.3200
USD/CAD is actively testing levels below the July-September support line. In addition, it has slipped below all the key daily MAs (200, 100, and 50). The price action that has been unfolding since the start of September so far corresponds to the bullish harmonic “Shark” pattern, which implies that the price should decline to the 1.3125/20 area (50-month MA, 200-week MA) first to complete the pattern before turning higher.
The disappointing data from the United States which increases the odds of the Fed’s rate cut in October and the better-than-expected figures from Canada may be the drivers of the short-term movement to the downside. Watch for the break below the support at 1.3180 to trigger the move to the mentioned downside targets.
If USD/CAD returns above 1.3230 (100-day MA), bulls will regain power and we’ll have to rethink the situation.
