What’s up with the US stock market?
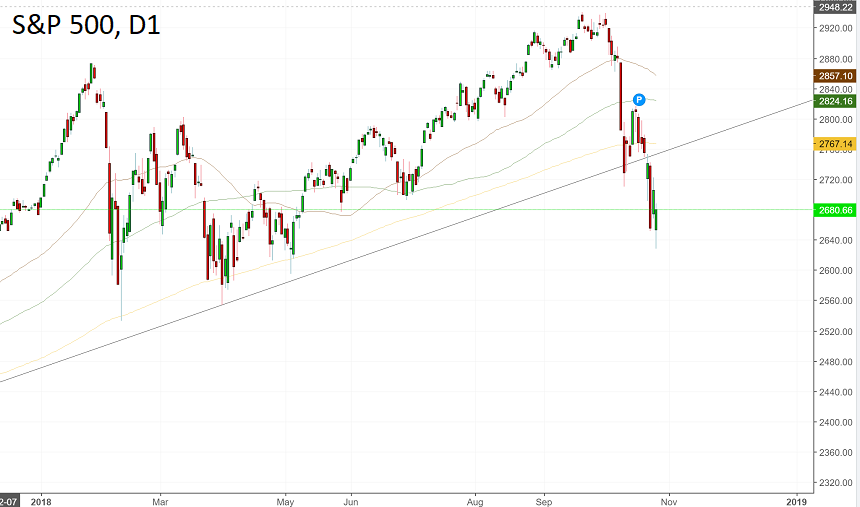
After the rough February and March, S&P 500 had been enjoying the period of steady growth, until it was hit by a selloff in October. American key stock index has lost more than 7% this month. VIX Index, which is measuring volatility, has doubled. Why did this happen, what to expect and how can this affect currency traders?
The reasons for the crash
Looking back, we can think of a number of reasons for the selloff.
- Tightening policy of the Federal Reserve. Interest rates in the United States go up and the Fed let the market know that it will continue hiking rates next year. Higher interest rates mean that borrowing will become more expensive for US companies. Hence, the negative impact on stocks.
- Continued trade tensions. So far, no end of the mutual tariff blows between the United States and China is in sight. This creates uncertainty and is bad for business.
- The bumpy earnings season. Investors had high expectations for the financial reports of American companies. While some of them turned out to be strong (Twitter, Microsoft, and Tesla), there were disappointments (Amazon.com Inc. and Alphabet Inc.). What’s more, concerns are now spreading about the fate of earnings in 2019.
- Political tensions in America. The US midterm election will take place on November 6, and the pressure is rising. Will the Republicans retain power in the Congress? The big question.
- Weak housing data. There are worries that rising prices will hamper US economic growth.
- Disappointing global growth. America is not alone in the world, and problems elsewhere may hurt it.
US stocks were overbought after an uptrend and that encouraged traders to take profit and close their bullish positions.
Technical analysis
S&P 500 settled below 50-week MA and 200-day MA. This is a bad sign. Some analysts started talking about a bear market. Technically the index looks vulnerable for a decline to 2,575 (100-week MA) and 2,530 (2018 lows). Analysts at Morgan Stanley expect S&P 500 index to fall to between 2,450 and 2,500 in 6-8 weeks. Buyers need to push S&P 500 above 2,700/2,750 to restore the uptrend.
On the positive side, there’s an observation that during the last 5 years S&P 500 has often found support when the P/E ratio (a price/earnings coefficient) declined to 15. This logic places support to 2,615, the nearby area. However, it's possible to count the P/E ratio on the basis of different earnings forecasts, so this argument shouldn't be regarded too eagerly.
The latest news is that US GDP growth turned out to be bigger than expected in Q3. American economic growth is propelled by President Donald Trump's tax cuts. S&P reacted positively. Let’s see whether this is enough to make investors start buying stocks once again.

Impact on the USD
The dynamics of the stock market gives a good indication of investors’ risk sentiment and thus influence the currency market.
The correlation between the US stock market and the USD changes from time to time. Last year, S&P 500 and the USD index were moving in inverse directions. During the most part of 2018, on the contrary, the indexes went up in tandem. Everything depends on whether investors concentrate on the strong economy and buy both stocks and bonds (pushing up the USD value), or on the downsides of higher interest rates and sell stocks, but buy bonds and the USD.
For now, it seemed that the performance of the American stock market is regarded more as a proxy of the US economic health. A rebound in S&P would be positive for the USD, while a further decline in stocks may stem the rise of the dollar without weakening it.