Open account
Open accountLog In
Open account

Aug 08, 2025

Basics

The Moving Average: a Key Method in Trading

The Moving Average: a Key Method in Trading

Take the price movements over a period of time, average them out, and you get a line that simplifies the data, into an easy-to-read line. It may expose patterns that weren’t so easy to spot with the naked eye. It can also help with risk, understanding a period of volatility, and identify entry and exit points.

The moving average (MA) is a bit of technical analysis that traders all over the globe place as a cornerstone of their strategy.

Types of moving averages

1. Simple moving average (SMA)

Add up the daily closing prices over a period of time, then divide the sum by the number of days in the period, and you can monitor long-term trends with all the noise filtered out. SMAs have one downside though: they’re relatively slow to respond and sometimes they miss fast shifts, or identify them too late.

2. Exponential moving average (EMA)

If you need quick info about current market conditions, you can place more weight on more recent prices. Its ability to react quickly allows traders to jump into trends earlier, albeit at the cost of being more prone to false signals during choppy market conditions.

3. Weighted moving average (WMA)

This is a mix of the SMA and EMA. It spreads out the weight it places on different price points, but still emphasizes the most recent ones.

Choosing the right moving average

  • SMAs are good for getting a bird’s eye view of market trends over a longer period like 200 days. This is generally good for longer-term investors.

  • EMAs tend to be good for day traders who need to see short bursts of market activity. A common period to apply it to is 10 days. This is good for Forex or crypto.

  • WMAs are for traders tracking intermediate-term trends with both precision and clarity.

Test different types of MAs across varying timeframes to find what aligns best with your trading style.

How moving averages enhance trading strategies

Moving averages hold value far beyond trend identification. By interpreting their behavior, traders can uncover new layers of market dynamics. Here’s how MAs can enrich your trading toolbox.

Identifying and confirming trends

The most straightforward use of a moving average is to determine the market’s trajectory. When prices are rising (i.e. in a bull market), your MA will slope upward and prices will steadily be above the line. Conversely, a bearish trend will be as a reflecting pool with prices below a declining MA.

Suppose a commodities trader sees gold prices rising above a 100-day MA, interprets this as bullish sentiment, and buys in. After that, they might be prone to overreact to a minor pullback, and sell in a panic, losing out on the whole thing and wasting their own time and money. The confirmation of an overall trend an MA provides will give that trader the confidence they need to hang on to their precious nuggets.

To make even more sure, pair a short-term MA with a long-term one. If your 20-day EMA stays above your 50-day EMA, for example, you can be pretty confident that the trend is indeed what it seems.

Serving as dynamic support and resistance

In a trend, prices will tend to gravitate back to a specific moving average before bouncing higher. A Forex trader might use a 50-day MA as a reference point, waiting for the EURUSD price to pull back near that level before entering a long position. You can pretty much use a moving average as a support or resistance line.

Crossovers

You can derive some effective signals from moving averages.

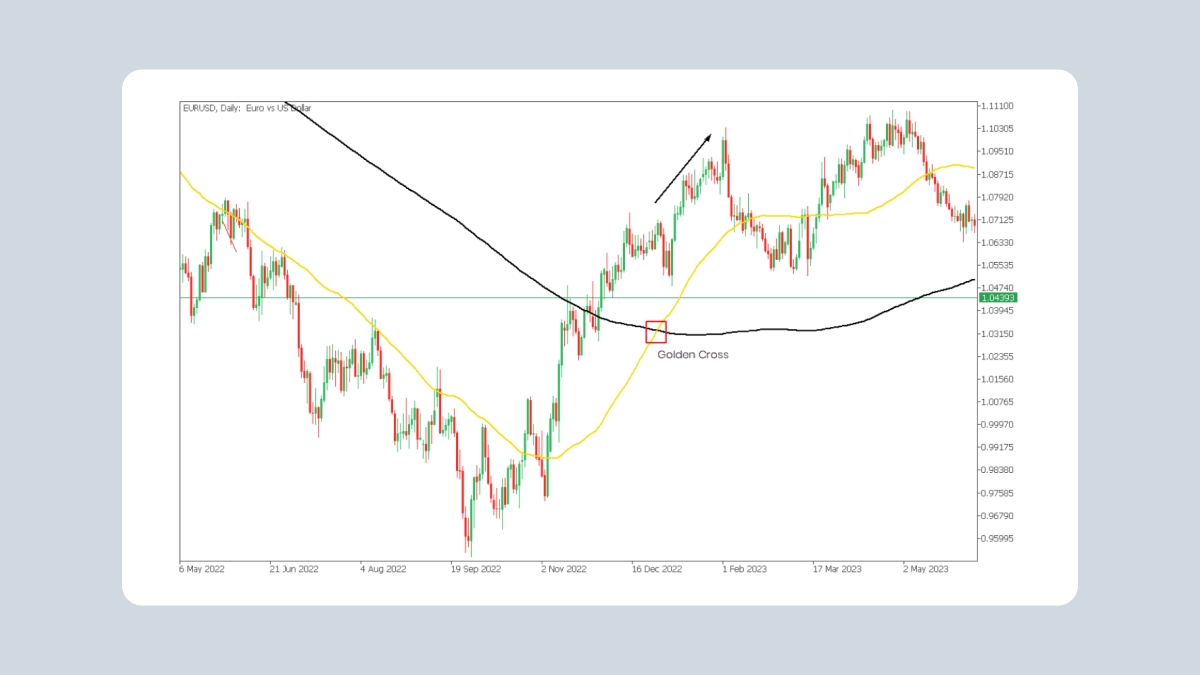
  • Golden cross
    If your 50-day MA passes above your 200-day MA, it’s the ideal time to buy.

Golden cross

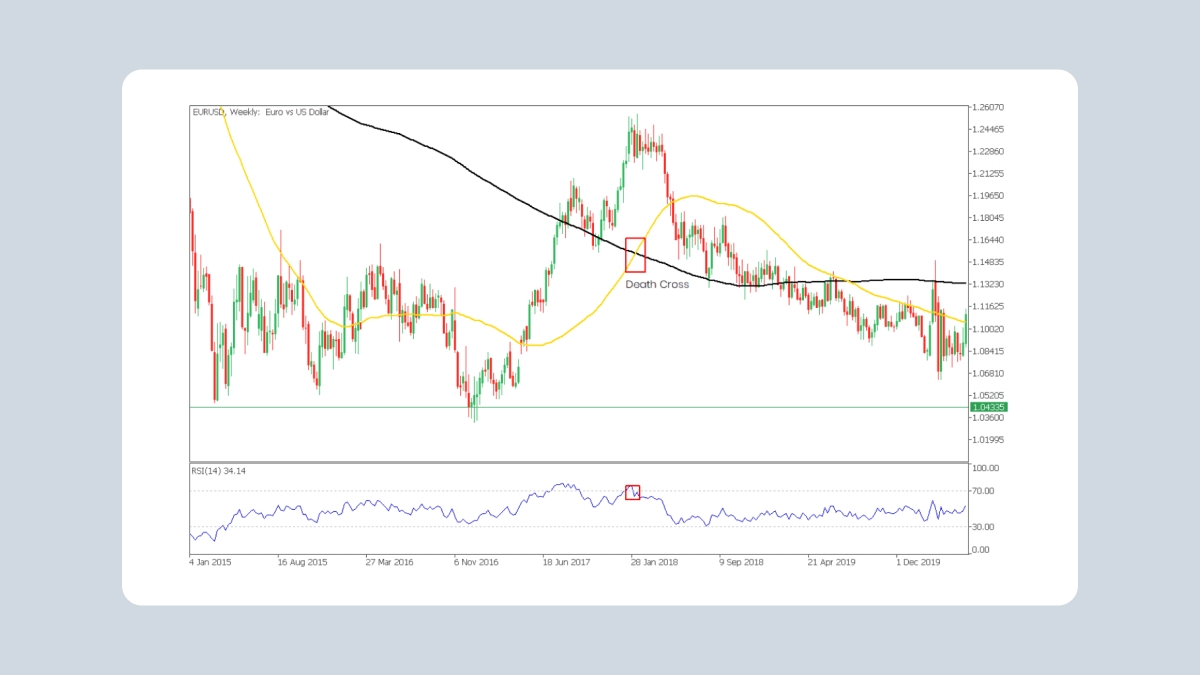
  • Death cross
    If the shadow side takes over and your short-term MA falls below your long-term one, drop that asset like it’s hot.

    Death cross

Advanced techniques

For those ready to take moving averages to the next level, these advanced methods offer enhanced precision and deeper market insights.

  • Moving average envelopes
    Envelopes create upper and lower bands around a moving average, calculated as a percentage above and below the MA line. Traders use these bands to identify overbought or oversold conditions.For example, if the price touches the upper band repeatedly, it may signal overextension, prompting traders to prepare for a pullback.

  • Moving average ribbon
    Imagine plotting ten moving averages, ranging from 5 days to 100 days, all on the same chart. This is a moving average ribbon. The visual representation helps gauge trend strength and identify reversals. A ribbon that aligns cleanly and slopes upward signals a strong upward trend, while a contracting ribbon warns that the trend is losing steam.

  • Dual moving average strategies
    Pairing different moving averages provides even more refined signals. A trader might use a 20-day EMA along with a 50-day SMA. When the shorter EMA crosses above the longer SMA, it’s a clear buy signal. Likewise, the reverse crossover signals a potential sell or short.

Advanced technique in practice

Suppose a trader applies the moving average envelope technique to crude oil futures. With envelopes set 3% above and below the 200-day SMA, they observe that the price has spiked past the upper band. This indicates that oil prices are overbought, suggesting a selling opportunity as the market cools.

Combining moving averages with other indicators

MAs pair seamlessly with other tools, creating powerful combos that boost accuracy and reduce false signals.

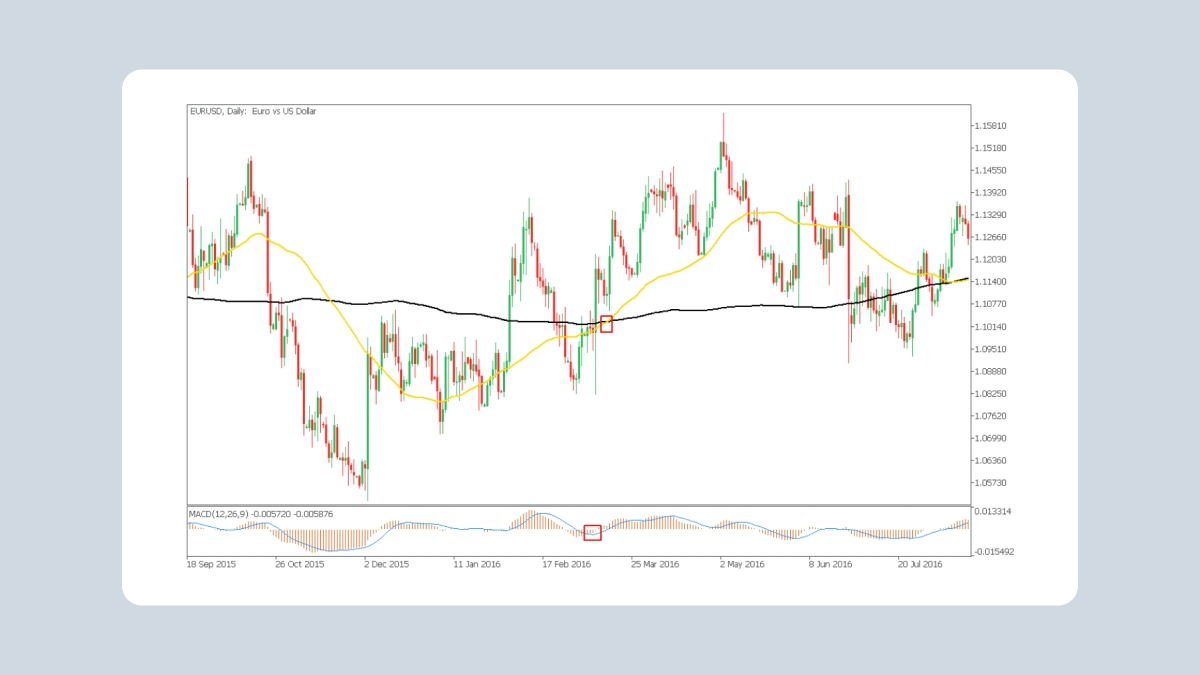
1. MACD

The moving average convergence divergence (MACD) indicator is built on EMAs, making it an ideal companion to moving averages. If a bullish crossover in the MACD aligns with a golden cross in the MAs, it’s a robust buy confirmation. Conversely, bearish confluence signals strengthen the case for a downturn.

MACD

2. RSI

Coupling moving averages with the relative strength index (RSI) adds a momentum dimension.

Imagine that a 20-day MA crosses above a 50-day MA while the RSI sits below 30. The oversold condition increases the likelihood of a meaningful upward reversal, offering traders confidence to initiate a long position.

3. Bollinger bands

Bollinger bands bring volatility into the mix by enveloping prices within upper and lower bands. If prices breach the upper band after a bullish MA crossover, traders interpret this as strong upward momentum. Alternatively, contracting bands paired with an MA breakout signal that a significant price shift may be imminent.

Practical applications

Across asset classes, moving averages offer consistent value.

Forex strategy

Picture a trader analyzing the USDJPY currency pair. A 20-day EMA along with a 50-day WMA shows the pair trending upward. When the 20-day EMA crosses above the 50-day, coupled with price clinging to the upper limit of moving average envelopes, the trader sees an optimal buy opportunity.

Stock scenario

Consider a scenario where a biotech stock consolidates just below its 200-day SMA. After a series of positive news events, the price dramatically breaks above the 200-day SMA on high volume, signaling a powerful breakout rally. Traders might use this move to establish long positions, confident that momentum will carry the stock higher.

Limitations of moving averages

Despite their many advantages, moving averages have limitations. Their reliance on historical data makes them lagging indicators, often delivering signals after the trend is already underway.

Additionally, in range-bound or sideways markets, MAs can generate misleading signals, with prices repeatedly crossing the MA without establishing a firm direction.

To mitigate these challenges, traders can extend timeframes to reduce the impact of noise or combine moving averages with other indicators, such as volume analysis, to refine market insights. Fundamental analysis can further complement MAs, providing a fuller trading picture.

Share with friends:

Open an FBS account

By registering, you accept FBS Customer Agreement conditions and FBS Privacy Policy and assume all risks inherent with trading operations on the world financial markets.

FBS at social media

iconhover iconiconhover iconiconhover iconiconhover icon

Contact us

iconhover iconiconhover iconiconhover iconiconhover icon
store iconstore icon
Get on the
Google Play
store iconstore icon
Get MT4 on the
App Store
store iconstore icon
Get MT5 on the
App Store

Trading

Company

About FBS

Our social impact

Legal documents

Company news

FC Leicester City

Help Center

Partnership programs

The website is operated by FBS Markets Inc.; Registration No. 000001317; FBS Markets Inc. is registered by the Financial Services Commission under the Securities Industry Act 2021, license number 000102/31. Office Address: The Bentley, #16 Cor A Street & Princess Margaret Drive, Belize City, Belize.

FBS Markets Inc. does not offer financial services to residents of certain jurisdictions, including, but not limited to: the USA, the EU, the UK, Israel, the Islamic Republic of Iran, Myanmar.

Payment transactions are managed by HDC Technologies Ltd.; Registration No. HE 370778; Legal address: Arch. Makariou III & Vyronos, P. Lordos Center, Block B, Office 203, Limassol, Cyprus. Additional address: Office 267, Irene Court, Corner Rigenas and 28th October street, Agia Triada, 3035, Limassol, Cyprus.

Contact number: +357 22 010970; additional number: +501 611 0594.

For cooperation, please contact us via [email protected].

Risk Warning: Before you start trading, you should completely understand the risks involved with the currency market and trading on margin, and you should be aware of your level of experience.

Any copying, reproduction, republication, as well as on the Internet resources of any materials from this website is possible only upon written permission.

The information on this website does not constitute investment advice, a recommendation, or a solicitation to engage in any investment activity.