.jpg)
What is a gap?
A gap is an empty space within a price chart between two neighboring candlesticks.
It occurs when a candlestick opens at a distance from the previous candlestick’s closing price. This may happen if the market’s view of the price rapidly changes and there’s a sudden influx of buy/sell orders. At some point, the price that was relevant at the close of the first candlestick is no longer interesting to traders, and the new price reflected by the second candlestick better represents the value of the asset (a currency pair).
In Japanese candlestick analysis, gaps are referred to as “windows”.
Here are the main types of gaps:
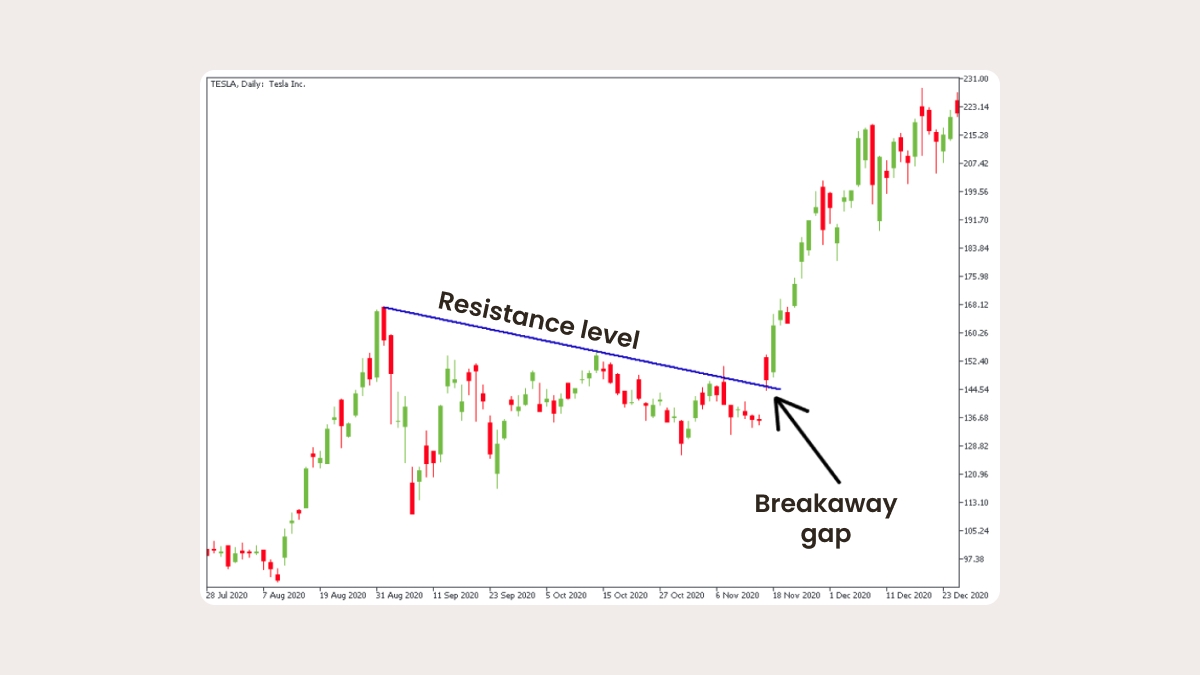
1. Breakaway gaps
Breakaway gaps occur at the end of a price pattern and signal the beginning of a new trend. Such gaps appear when the price is testing a level on the chart – support, resistance, trend line, trend channel, etc. The price suddenly gaps through the tested level and then starts a new trend in the direction of the breakout. It’s easy to spot breakaway gaps on a chart. By spotting a gap, a trader can join a new trend at the earliest stage.
Here is an example of a breakaway gap on a chart of Tesla. That jump was caused by the news that Tesla was going to be added to the S&P 500.
Tip: breakaway gaps often occur after important news or economic releases.
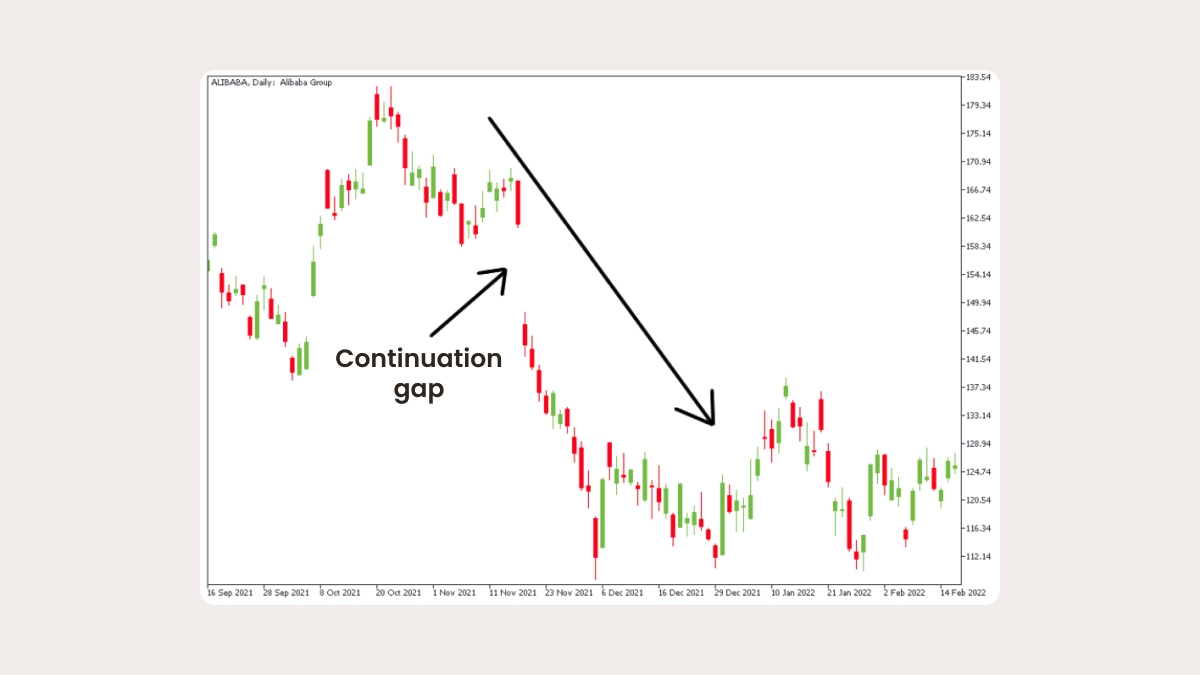
2. Continuation gaps
Continuation gaps happen in the middle of a price pattern and signal a rush of buyers or sellers who believe that the price will continue going in the same direction. In other words, if you see a bullish gap during an uptrend, then you have a bullish continuation gap in the price chart. If a trend is bearish and a bearish gap is formed, then it’s a bearish continuation gap.Continuation gaps are usually smaller if compared to breakaway or exhaustion gaps. The gap is usually filled during the trading session and its direction can be random, meaningless, or a result of market noise.
This Alibaba chart shows an example of a continuation gap.
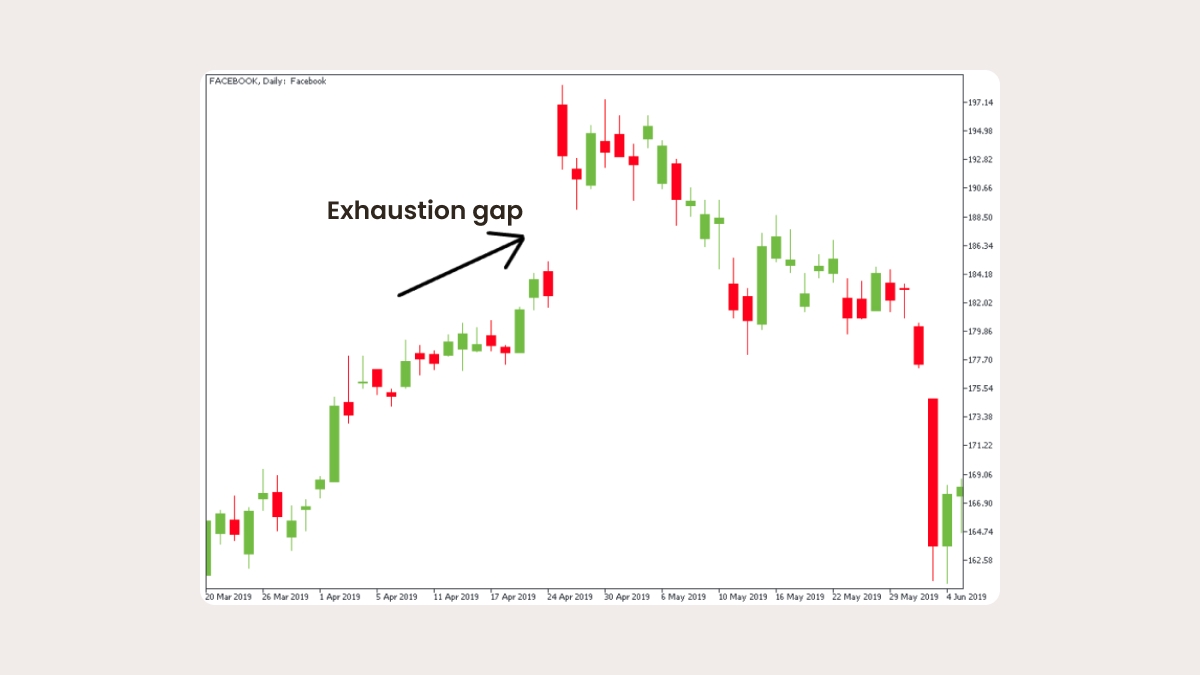
3. Exhaustion gaps
Exhaustion gaps take place near the end of a price pattern and signal a final attempt to hit new highs or lows. During this time, the last portion of market players joins the trend. After this, there will be no one left to support this trend. An exhaustion gap therefore signals a reversal in price action.
It’s possible to mistake an exhaustion gap for a continuation. To make the right distinction between these two types of gaps, have a look at the size of the candlesticks: if a currency pair is very volatile, the candlesticks are big, and the price has made several jerking movements, it might be an exhaustion gap.
This Facebook chart shows an exhaustion gap. After the last jump, there was no one to support the continuation of an uptrend, and the stock reversed downward.
In addition to the gaps mentioned above, you might also see common gaps. These are gaps that can’t be placed in a price pattern, and simply represent an area where the price has gapped.
Weekend gaps
A specific type of gap takes place after weekends. As you know, the Forex market is not very active on Saturday and Sunday, so the main currency trading ends on Friday and starts on Sunday night with the opening of the Asia-Pacific trading session. Yet, important events may happen while the market stands still. The news may include a great number of things from political announcements and interviews to natural disasters. As a result, a great number of trading orders are accumulated before the market opens. These orders are not met with counter orders. As there’s no demand/supply, market players have to open positions at prices that are higher/lower than those seen at close on Friday. These weekly gaps are easy to spot on M1-H4 timeframes. Sometimes, when something really big happens over the weekend, the opening gap can be very wide.
Slippage
Slippage is the difference between the expected price of a trade and the price at which the trade actually executes. Market gaps can cause slippage, which may affect stop and limit orders – meaning they will be executed at a different price from that requested. One of the more common ways that slippage occurs is as a result of an abrupt change in the bid/ask spread. When this happens, market orders may get executed at less favorable or more favorable prices than originally intended. Slippage is a part of investing, but there are some ways to avoid it or limit its impact. Slippage usually occurs when markets are volatile or liquidity is lacking, so timing and the type of security you're trading can play a big role.
Summary
In this article, you learned how gaps are formed and what types of gaps there are. You also looked into the differences between gap types in detail. You read about how to use gaps to predict price movement in advance. In addition, you’ll be ready for slippage that gaps may cause.