Introduction to the Elliott Wave Theory

What is the Elliott Wave Theory?

The Elliott Wave Theory is a technical analysis theory that is used to identify and describe waves ― long-term recurring fractural price movements in financial markets. Nowadays, the Elliott waves are one of the most popular tools used for Forex forecasting. It’s also the only tool in our experience that can sort out the price movement on every timeframe from the Monthly or even Yearly charts to just one-minute intraday intervals.

In this article you will learn more about how the Elliott Wave Theory works, what types of waves there are, and how to use Elliott waves in trading.

Who is the author of the theory?

The Elliott Wave Theory was developed by Ralph Nelson Elliott (1871 ― 1948), a famous economist and accountant. He conducted a systematic study of stock market data and in 1938 published a book called ‘The Wave Principle’ where he provided a detailed account of his findings. In his book he states that while the stock market might seem unpredictable, the prices actually move in accordance with pre-defined natural laws and can be measured with the help of the Fibonacci numbers. Elliott also describes these natural laws and in his later publications explains how his method of market forecasting works.

Nowadays, most traders follow rules and guidelines on the Elliott Wave published in Robert R. Prechter Jr. and A.J. Frost’s book called 'Elliott Wave Principle: Key to Market Behavior'.

Understanding the Elliott Wave Theory

While studying stock market data, Elliott carefully examined seventy-five years of price data, ranging from yearly to half-hourly index charts. In his publications he laid down the rules on how to identify and predict wave patterns in price movements and make the most profit out of them. Nowadays, his work is used by portfolio managers, traders, private investors and financial analysis and market forecasting companies all over the world.

At the same time, Elliott cautioned others against trusting in these patterns blindly as they don’t guarantee that the price is going to move only in one possible way. Rather, Elliott waves help traders understand the probability of future market action. It’s still better to combine this tool with other technical analysis methods to get a clearer picture of the market situation.

How Elliott waves work

According to the Elliott Wave Theory, stock prices move in recurring up and down patterns similar to waves. This, supposedly, makes them easy to predict, as just like waves, these patterns occur with a frequency that can be calculated and forecast if you know the applicable rules. Elliott suggests that these price swings happen because of the collective psychology of investors.

Elliot wasn’t the first to conclude that stock prices move in waves. This sentiment had been expressed in the Dow theory several decades earlier. But what Elliott did discover is that financial markets are fractal, meaning that market prices infinitely repeat themselves. This allowed him to look at these repeating patterns closely and analyze whether they can be used to predict future price movements.

Market predictions based on wave patterns

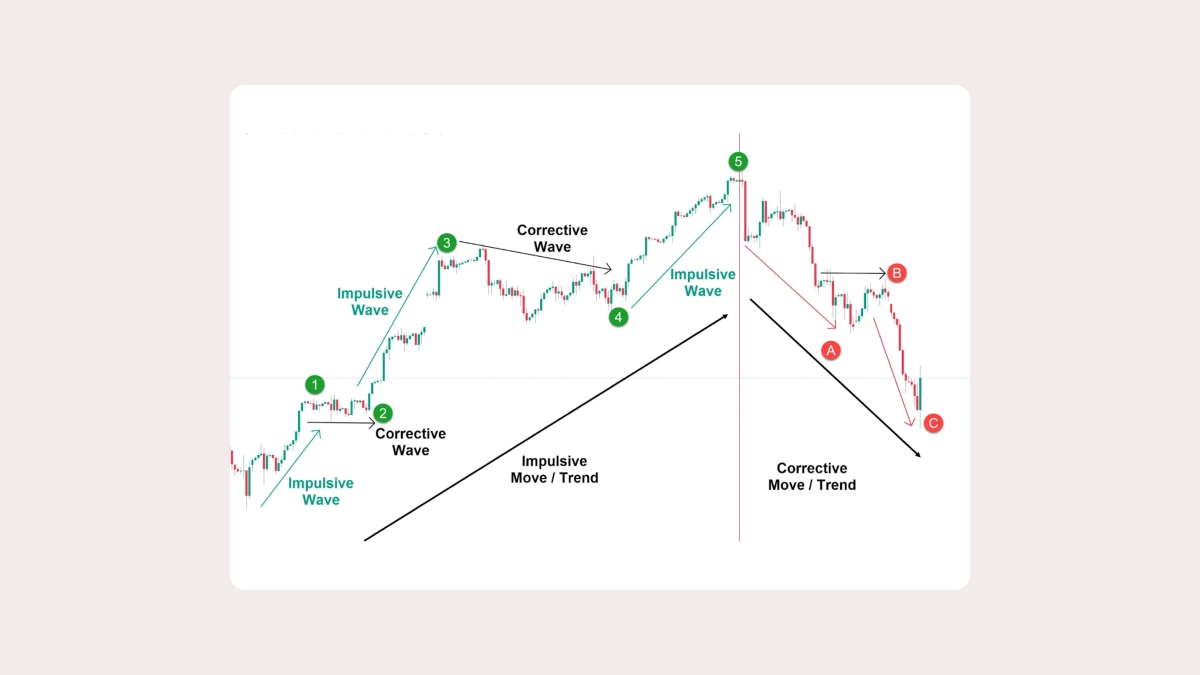
After extensive study Elliott concluded that there are two different types of waves in financial markets: motive waves (or impulse waves) and corrective waves. An impulsive wave appears in the same direction as the main trend and usually has five waves within the pattern. A corrective wave, on the contrary, happens in the direction opposite to the main trend. These characteristics of the wave patterns, as Elliott discovered, can help make market predictions, especially when it comes to predicting the main direction of prices and the possibility of corrections against the trend.

Impulse waves

An impulse wave is one of the two wave patterns defined by Ralph Nelson Elliott. Impulse waves coincide with the main direction of price movement – in uptrends they refer to upward movements and in downtrends they mark downward movements. Impulse waves can be used to predict the future direction of the trend and are generally considered trend-confirming patterns.

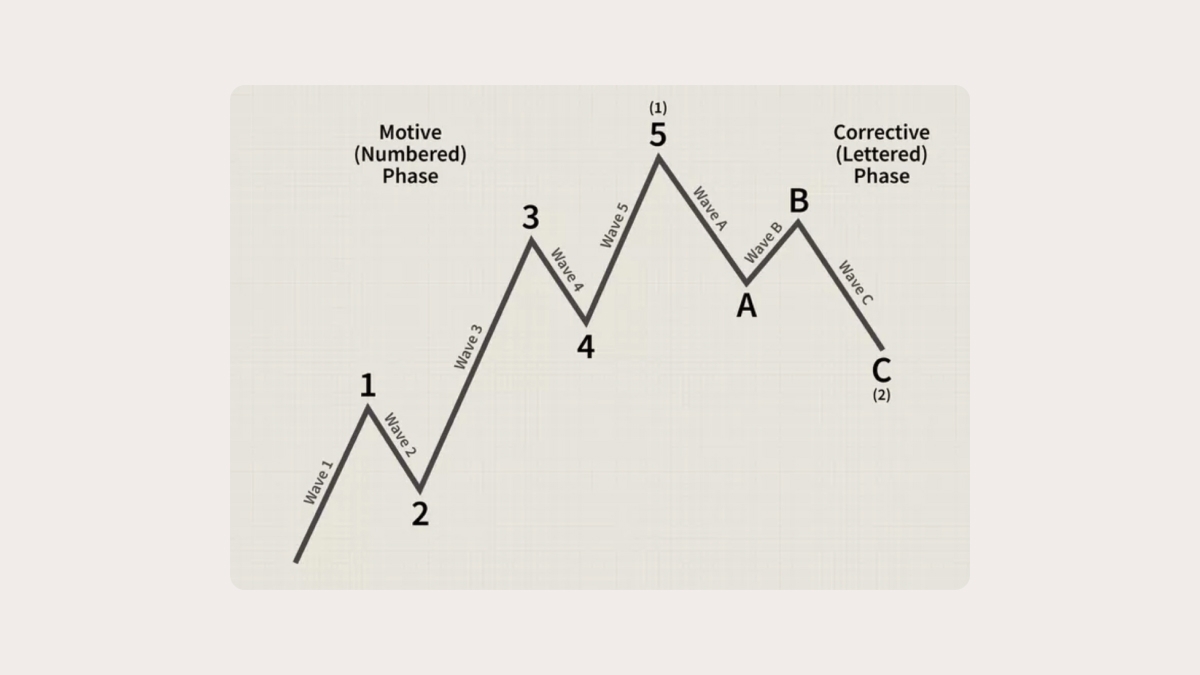
Impulse waves consist of five sub-waves that move in the same direction as the main trend. Three of them are motive and move in the direction of the main trend while the other are corrective waves.

Motive waves.png

Since an impulse wave as a pattern consists of five sub-waves, each of them signifies different stages of public interest in the stock. Let’s look at the chart. During Wave 1, only a small number of people buy the stock, which causes the price to rise. Then, when these traders think the price has risen far enough, they start to sell, which causes the price to go down slightly, and corrective Wave 2 appears. After this comes Wave 3, which means that the general public got interested in the stock and started to buy it. The price gets higher and higher and usually exceeds the high from Wave 1. Naturally, when traders consider the stock expensive again, they sell it, causing another corrective Wave 4, but much weaker. The final wave of the pattern, Wave 5, signifies the highest interest in the stock, causing the price to fly high.

But traders should be careful that an impulse wave forms only in accordance with specific rules. If these rules are broken, the formation on the chart is not an impulse wave. The rules in question are as follows:

  • Wave 2 can’t retrace more than 100% of Wave 1;
  • Wave 3 must be longer than either Wave 1 or Wave 5;
  • Wave 4 can’t overlap Wave 1.

If these rules are abided, then it’s highly likely that the formation you see on the chart really is an impulse wave.

Corrective waves

After an impulse wave pattern you can expect to see a three-wave corrective wave pattern. Corrective waves move against the trend, reversing highs or lows that have been previously reached.

Corrective waves consist of three sub-waves: two corrective ones and one weak motive wave.

Elliott stated that there are 21 corrective wave patterns. Some of them are simple, some of them are complex, but all of them can be subdivided into three main categories.

  1. Zig-zags. Zig-zag formations consist of three sub-waves with the motive sub-wave being the shortest in comparison to the corrective sub-waves. Zig-zags can be linked together and happen several times in a row within one correction.Zig-zags.png
  2. Flats. In flat formations all waves are generally equal in length with each other. Each of the following waves reverses the previous wave’s move.FLATS.png
  3. Triangles. In triangle formations corrective patterns are restricted by either converging or diverging trendlines. Waves in triangles move sideways against the trend. Depending on the direction of the price movement, triangles can be ascending (bullish), descending (bearish), or symmetrical (can go either way).Ascending Triangle.png

Special considerations

Elliott noted that the number of waves in impulses or corrections actually correlates with the Fibonacci sequence and that their movement within a chart matches Fibonacci ratios.

There are many technical indicators based on the Elliott Wave Theory. For example, the Elliott Wave Oscillator combines both Elliott waves and moving averages in order to predict the direction of future price movements more precisely.

How do you trade using the Elliott Waves Theory?

Elliott Waves Theory can help you decide what steps you can take in order to ensure your trade is successful and profitable. For example, if you see an impulse wave in an uptrend, you might want to buy the stock and short it when the fifth sub-wave is complete. If the wave pattern is over, you might also wait for the recurrence of the wave pattern as they are fractal patterns and repeat themselves after some time.

The beginning of the journey

Now that we understand what the Elliott Waves Theory is, let’s look more closely at how you can apply it in practice. The following explanations use the rules and guidelines from 'Elliott Wave Principle: Key to Market Behavior', but all examples were taken from the real market.

Market’s LEGO

As we already learned, there are two main components in the Elliott Wave Theory: impulses (five-wave price movements) and corrections (three-wave price movements).

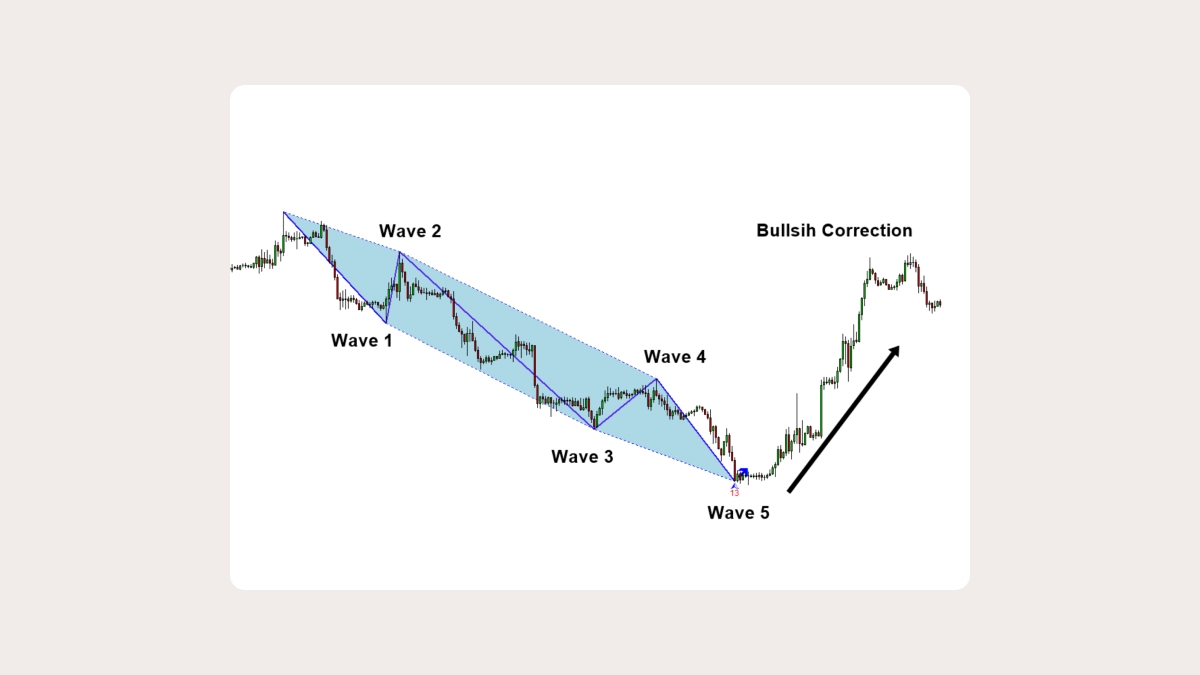
Let's have a look at the chart below. You can see there is a five-wave decline – that's an impulse wave (there are some cases where a five-wave correction is possible). Also, there's a three-wave advance, which we can consider a correction. Now that we’ve found an impulse and a correction, it's time to look at the bigger picture.

1528299580-deae538e0ae2e48af624aff42e40b26a_1200x1200_q90v3.png

The next chart is just the real wave count. The third wave of the bearish impulse is likely motive and continues with the decline while the fourth wave bounces upwards.

1528299598-f30fcc7024149c09bc3c628e708228ee_1200x1200_q90v3.png

This allows us to come to the following conclusion: waves cannot stay apart from the others. The Elliot waves are like a Russian nesting doll (Matryoshka). Each wave is a part of another wave, but also each wave consists of smaller waves. This applies to both higher and lower timeframes.

And this makes the Elliott Wave Theory different from other methods of market analysis. The majority of the technical analysis approaches focus on patterns and signals that stand aside from each other and aren’t related to one another. The power of the Elliott Wave Theory is that it gives traders the ability to see the bigger picture, not an individual setup only.

Thinking opportunities

You’ve probably heard that if you use the Elliott Wave Theory in trading, you will come across more than one possible wave count. Usually, you have a few possible scenarios, and some of them are contradictory. But this is actually the most exciting thing about the Elliott Wave Theory. It's like playing chess – you have to think your next move through before making it.

If some holy grail indicator tells you to buy or sell, you wouldn't think about what you're going to do if something goes wrong. With the Elliott Wave Theory, you are trying to figure out your next step depending on which wave count is in place at the moment. This is a core skill of a successful trader.

Real examples

Let’s get to some real stories. The first example is the DJI index. In September 2016, the index reached the historical high, and I spotted a visibly bullish wave pattern. I expected the market to rise much higher because the fifth wave was far from over.

1528299633-5fc46f0e7b6138237037cb8cabe3948a_1200x1200_q90v3.png

A few months later, the market climbed even higher, but I still stuck to the bullish strategy. This expectation was based on some things in the Elliott Wave Theory we're going to learn soon, but for now, you can see how it worked.

1528299651-5f443a5139fbcadf508d14b67fe716aa_1200x1200_q90v3.png

In the end, the trend is still moving upwards, and you can see the current wave count below.

1528299966-7ff71b28ff9d1b405ecdb07bc33b91c5_1200x1200_q90v3.png

The second example is USD/TRY. In October 2016, the fourth triangle wave seemed to be over, so I expected another bullish impulse, which developed in the next few months.

1528299718-28d1ad7d8eff8dab4faa4b64e95a8e4a_1200x1200_q90v3.png

After this, there was a long bearish correction, which finally ended, and the bullish trend went on as expected.

1528299762-fbb76159fd9f826e6b93b53c67b4df51_1200x1200_q90v3.png

Finally, in April, 2018, there was another bullish swing because Wave 4 seemed to be almost over. As a result, the market climbed even higher.

1528299787-3e56744212783f7f415360358b0abe5d_1200x1200_q90v3.png

Popularity of the Elliott Wave Theory

Despite having been presented to the general public in the late 1930s, the Elliott Wave Theory became widely popular only in the 1970s. It was then used to predict the bull market of the 1980s and the crash of 1987. Nowadays, the Elliott Wave Theory is considered one of the classic technical analysis tools and is widely used by traders all over the world.

The bottom line

The Elliott Wave Theory is one of the most popular methods used to predict future price movements. Seemingly straightforward, in reality it’s not as cut and dry. Traders need to know a lot of rules surrounding the Elliott waves to correctly identify them on the chart. It’s also quite difficult to predict when the wave is going to be over and plan your next move accordingly. So in order to use this method to its maximum potential, it’s better to combine it with other technical analysis tools.

Frequently asked questions

  • What is an Elliott wave?

    An Elliott wave is a chart pattern that either shows the continuation of the trend (an impulse wave) or a correction to the trend (corrective wave). Elliott waves are used to analyze financial markets and predict future price movements.

  • What is the Elliott wave cycle?

    The Elliott wave cycle consists of eight waves: five impulse waves and three corrective waves. During the impulse waves the trend goes on and then moves in the opposite direction during the corrective waves. Afterwards, according to Elliott, the cycle starts over and repeats the same sequence of rises and falls again.

  • How to use Elliott waves?

    Traders can use Elliott waves to find the most fitting moment to enter or exit a trade. For example, if you see an impulse wave in an uptrend, buy the stock and then sell it when the fifth wave of the pattern is over and a reversal is about to start.

  • How to draw Elliot waves?

    In order to draw Elliott waves, you need to identify where one of them ends and another begins. For example, in an impulse wave pattern wave 1 follows the direction of the trend, and once it ends, the corrective wave 2 starts. The rest of the waves follow each other without a break.

Latest news

USD: Powell Speaks on Cutting Interest Rates

Jerome H. Powell, the Federal Reserve chair, stated that the central bank can afford to be patient in deciding when to cut interest rates, citing easing inflation and stable economic growth. Powell emphasized the Fed's independence from political influences, particularly relevant as the election season nears. The Fed had raised interest rates to 5.3 ...

BTCUSD: Rich Dad Says Buy

Robert Kiyosaki, the author of "Rich Dad Poor Dad," has updated his bitcoin price forecast, now projecting the cryptocurrency to hit $100,000 by September. He plans to acquire more bitcoin before April, attributing his decision to the upcoming halving event. Kiyosaki advises investors to consider adding bitcoin to their portfolios and suggests...

WTT: Currency Pairs To Trade In April

Hello again my friends, it’s time for another episode of “What to Trade,” this time, for the month of April. As usual, I present to you some of my most anticipated trade ideas for the month of April, according to my technical analysis style. I therefore encourage you to do your due diligence, as always, and manage your risks appropriately.

Deposit with your local payment systems

Data collection notice

FBS maintains a record of your data to run this website. By pressing the “Accept” button, you agree to our Privacy policy.

Callback

A manager will call you shortly.

Change number

Your request is accepted.

A manager will call you shortly.

Next callback request for this phone number
will be available in

If you have an urgent issue please contact us via
Live chat

Internal error. Please try again later

Don’t waste your time – keep track of how NFP affects the US dollar and profit!

You are using an older version of your browser.

Update it to the latest version or try another one for a safer, more comfortable and productive trading experience.

Safari Chrome Firefox Opera