-
How to start trading?
If you are 18+ years old, you can join FBS and begin your FX journey. To trade, you need a brokerage account and sufficient knowledge on how assets behave in the financial markets. Start with studying the basics with our free educational materials and creating an FBS account. You may want to test the environment with virtual money with a Demo account. Once you are ready, enter the real market and trade to succeed.
-
How to open an FBS account?
Click the 'Open account' button on our website and proceed to the Trader Area. Before you can start trading, pass a profile verification. Confirm your email and phone number, get your ID verified. This procedure guarantees the safety of your funds and identity. Once you are done with all the checks, go to the preferred trading platform, and start trading.
-
How to withdraw the money you earned with FBS?
The procedure is very straightforward. Go to the Withdrawal page on the website or the Finances section of the FBS Trader Area and access Withdrawal. You can get the earned money via the same payment system that you used for depositing. In case you funded the account via various methods, withdraw your profit via the same methods in the ratio according to the deposited sums.
Moving Average
Moving Average is one of the widely used indicators in trading. Traders love it because of its simplicity and effectiveness. In this article, we’ll explain what this indicator is and how to use it to lift your profit.
What is the Moving Average?
Moving average is a trend indicator. It takes average price figures and, as a result, smooths price action from fluctuations.
Types of Moving Average
There are four main types of the Moving Average in MetaTrader. It’s important to understand the idea of each type.
Simple Moving Average
Usually, traders use the Simple Moving Average. This type of the MAs shows the average of close prices for the period it considers. As a result, all prices are equal in value. For example, if we have 10-day MA, we calculate a sum of 10 close prices and divide it in 10. Every time a new close price forms, the oldest one isn’t counted anymore.
Exponential MA and Linear Weighted MA
Exponential MA and Linear Weighted MA are quite similar. They calculate the latest prices with the higher coefficient. As a result, these MAs reflect price’s moves the most and give signals faster. Be careful! These MAs give fast signals but some of them may be fake.
Smoothed MA
Smoothed MA is based on the Simple MA. It’s easy to define its major function after the first glance at its name. This MA clears price moves from fluctuations the most. This MA is the best to define the trend.
How to implement in MetaTrader
MA is set in MetaTrader, so you don’t need to download it. Go to “insert” – find “indicators” – go to “trend” – and you will see the Moving Average. It’s more important to apply correct settings.
MA Period
A period is the number of candlesticks that will be taken into consideration for calculating. The bigger period is, the smoother MA and more accurate signals will be. The smaller the period, the closer the MA will be to the price.
There’s no single rule what period of the MA to use. Analyzing charts with big timeframes, traders prefer MAs with such periods as 50, 100, and 200. To trade on smaller timeframes, investors prefer small periods such as 9, 12, and 26.
MA Price
There are several options. It can be close, open, high, low, median, typical, and weighed close prices.
The open and close prices are clear, but what are median, typical, weighted prices? They all use the different price for calculation the average.
- The median price is the middle point of the trading range for each period.
- The typical price is the approximate average price for each period.
- The weighted average takes into account the varying degrees of importance of the numbers in the price data.
Let’s consider an example. MA20 is a 20-period average. If we take 20 opening prices, or 20 closing prices, the result will be different, so the lines will be slightly different too. In the picture you can see where to choose the desired type of price list.
However, usually, traders use the close price.
MA Shift
This setting is used to pull the indicator forth and back in time. As a result, the MA will move up or down.
How to use Moving Averages in Forex trading
MA is a trend indicator, so we will start with a trend detection. If you want to find out whether the market is bearish or bullish, a cross will help you.
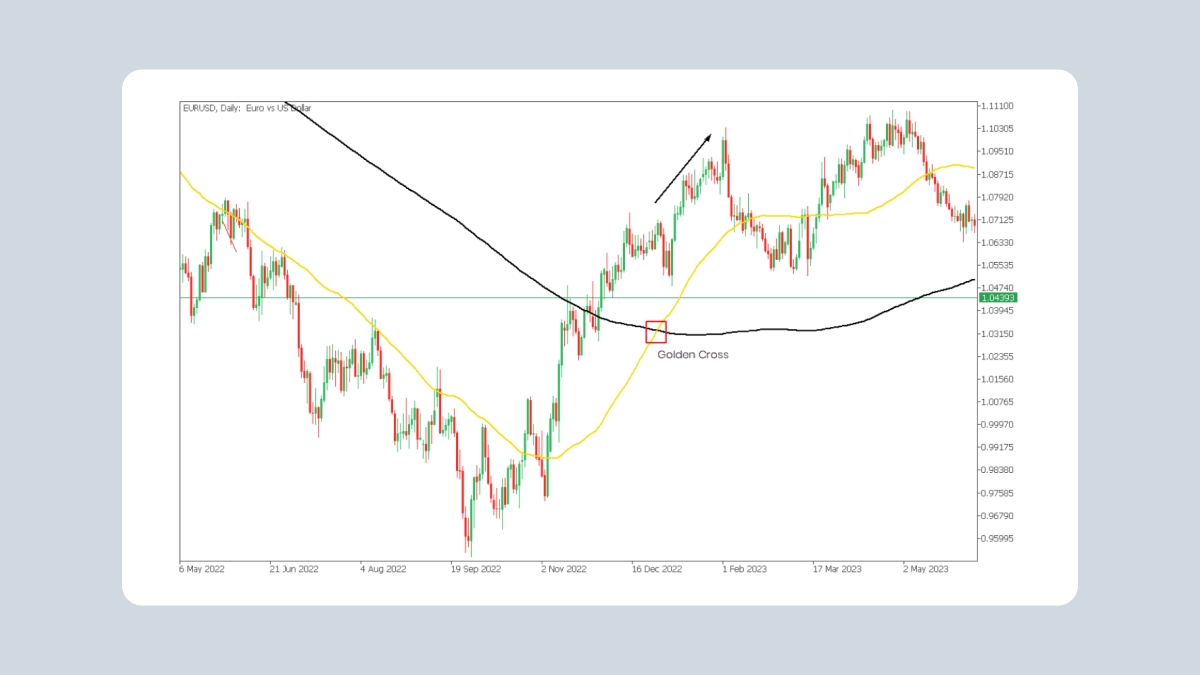
Golden cross
When an MA with a smaller period crosses an MA with a bigger period bottom up, it’s a signal to buy.
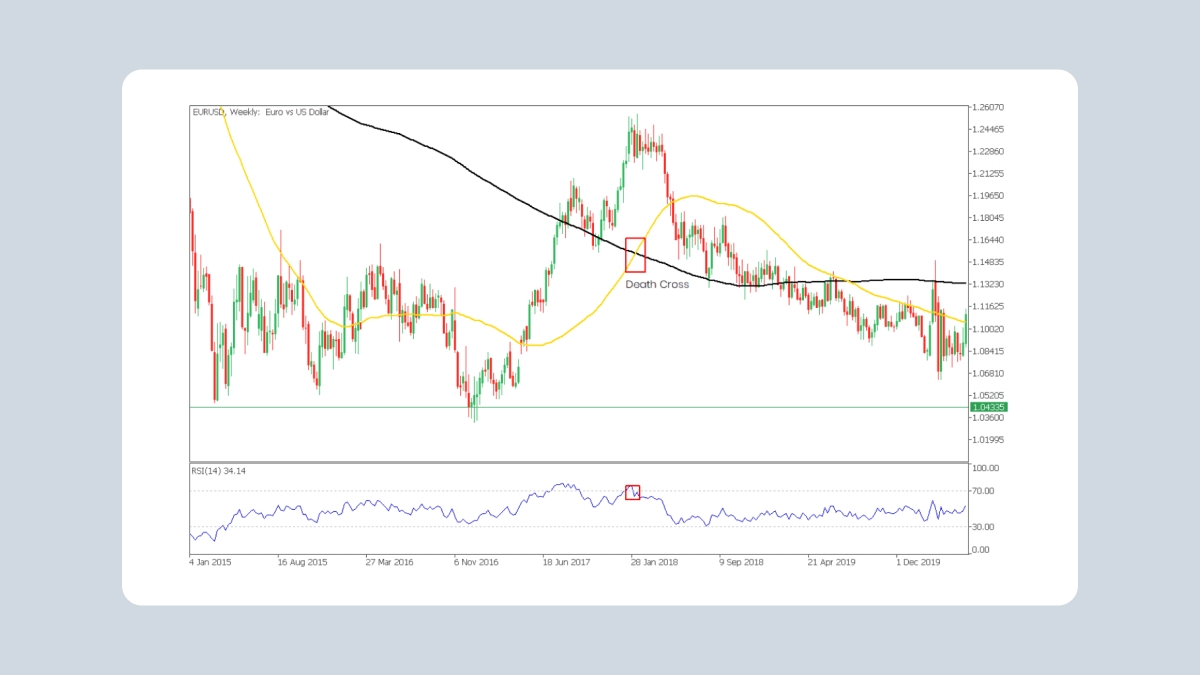
Dead cross
When an MA with a smaller period crosses an MA with a bigger period upside down, it’s a signal to sell.
Moving Average and the trend
Now let’s talk about the trend function. If the indicator goes down, it’s a downtrend. If the MA goes up, it’s an uptrend.
Moving Average and the support/resistance levels
Moving Average indicator is highly used as support and resistance levels. The strength of the levels depends on the period of the MA. The bigger the period, the stronger the support/resistance. The timeframe plays an important role as well. The bigger the timeframe, the stronger the MAs will be. If you compare the 200-hour MA to 200-day MA, the latter will be a stronger level and as a result, more likely the price will fluctuate near it.
Using MAs as support and resistance levels, we get a chance to determine levels to open a position. When the price breaks above the MA, it may be a signal to buy. Vice versa, a breakthrough below the MA will give a sign to sell.
Tip: if the price hits the MA several times, it means that a reversal is probably close.
It’s always a good idea to use Japanese candlestick chart. The patterns there may give strong signals of a reversal and a continuation of a trend.
Moving Average Advantages
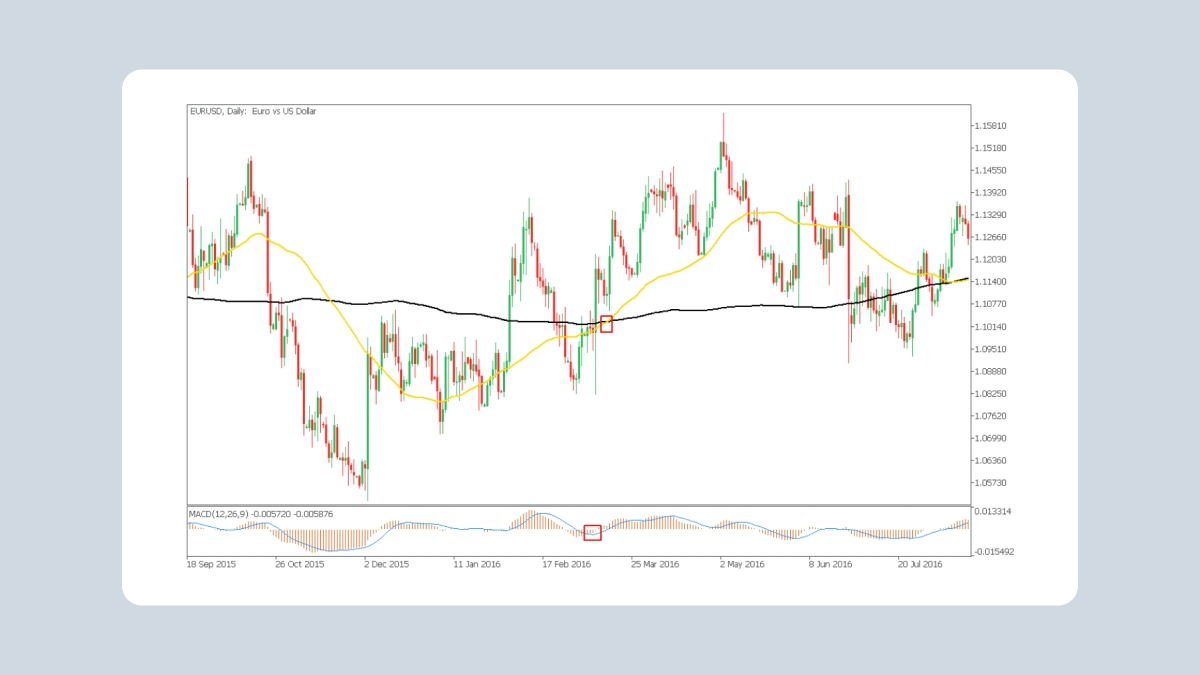
A great advantage of MAs is that they are not the only indicator; they are a part of other technical indicators. The most famous indicator based on MAs is MACD. You can also find MAs in such trading tools as Alligator, Bollinger Bands, Ichimoku Kinko Hyo.
The multifunctionality of MA is another crucial benefit. It identifies a direction of a trend and visually shows it on the chart. Besides, it finds trend reversals, and finally, MA shows potential support and resistance levels.
MA is really effective instrument due to its simplicity. That’s why it’s very popular.
Moving Average Disadvantages
No method is perfect, and moving averages have their drawbacks. Let’s talk about some of the most discussable ones.
- Moving averages only draw trends based on past price information. Like any technical analysis tool, charting indicators don’t take into account changes in fundamental factors that may affect the future performance of an asset's movement, such as new competitors, higher or lower demand for products in the industry, or changes in the company's management structure.
- There is an ongoing debate about whether more emphasis should be placed on the very last days of a time period, for example, with exponential moving averages. Many believe that the latest data better reflects the direction of an asset's movement, while others believe that making some days more important than others misrepresents the trend.
- Assets often have cyclical behavior that is not reflected by moving averages. So, if the market jumps up and down a lot, moving averages are unlikely to catch any significant trends.
- The purpose of any instrument is to predict where the price of an asset will be in the future. However, if it’s not moving in either direction, it doesn’t provide a signal to profit from either buying or selling short.
Moving Average and other technical indicators
We always remind traders that there is no perfect indicator that’s why it’s important to combine them to get stronger signals. Moving Averages, for example, work well in combination with other indicators.
MA and Momentum
Momentum indicators, such as the average directional Index, ADX, or MACD, often indicate an impending change in market direction before price moves far enough to trigger a moving average crossover. Therefore, traders often use such momentum indicators as early warning signs that the market has either topped or bottomed, or is about to make another jump forward in the current trend.
MA and Oscillators
Oscillators are great in combination with MAs. Moving Average crossovers can also confirm the signs from RSI that the market is overbought or oversold. The RSI is often used to get early signs of possible trend changes. Therefore, adding exponential moving averages (EMAs) can help, as they react more quickly to recent price changes. Relatively short-term Moving Average crossovers, such as EMA 5 crossover with EMA 10, are best for working together with the RSI. When EMA 5 gets below EMA 10, it confirms the RSI indication of overbought and a possible trend reversal to the downside. Conversely, an upward crossover provides an additional indication that the market is oversold and will soon turn up.
Always look for confirmation. Remember that you need at least two matching signals, to start trading.
Top 4 questions about Moving Average
Let’s now answer the most popular questions that beginner traders ask.
Is moving average a good indicator?
No indicator is perfect. MA is not the exception and has its own pros and cons. It’s great for trend identification, however, it delays and doesn’t show new information. Still, it’s one of the most popular indicators to use.
Why is the Moving Average method used?
Traders prefer to use the Moving Average method because it helps smooth out the price data by creating a constantly updated average price.
What moving average to use for different trading styles?
The period of MA depends on a trader's style and goals. Short moving averages (5-20 periods) are best suited for scalpers and day trading. Traders interested in swing trading will choose longer moving averages, which may have a period of 20-60. Position traders will prefer moving averages with 100 or more periods.
What Moving Average to use for crypto?
In general, it doesn’t matter what asset you trade with MA, it depends more on the trader’s style. However, the crypto market is a mostly trend market. So, using Moving Averages to smooth out price action and determine the overall trend direction can really help during crypto trading.
Conclusion
Let’s generalize what you read above. Moving Average is the trend technical indicator that reflects price moves. It’s a trend indicator, so it works best when the market is in an uptrend or in a downtrend. Buy when the price is above the MA and when you see a golden cross. Sell when the price is below the MA and you come across a dead cross.
2022-09-14 • Updated
Other articles in this section
- The McClellan Oscillator
- Aroon Indicator Trading Strategy
- Currency strength
- Moving Averages Ribbon: How to Find Entry Point
- Best Time Frames for Trading
- Renko charts Japanese candlestick chart
- Types of charts
- How to Use a Heikin-Ashi Chart?
- Quantitative Easing Policy (QE)
- Pivot Points
- What Is a ZigZag Indicator?
- Williams’ Percent Range (%R)
- What Is Relative Vigor Index (RVI Indicator)?
- Momentum
- Force index
- What Is Envelopes Indicator?
- Bulls Power and Bears Power
- Average True Range
- How to trade on central bank decisions?
- CCI (Commodity Channel Index)
- Standard deviation
- Parabolic SAR
- Trading with Stochastic Oscillator
- Relative Strength Index
- MACD (Moving Average Convergence/Divergence)
- Oscillators
- ADX Indicator: How To Use It For Effective Forex Trend Analysis
- Bollinger bands
- Trend indicators
- Introduction to technical indicators
- Support and resistance
- Trend
- Technical analysis
- Central Banks: policy and effects
- Fundamental factors
- Fundamental Analysis in Forex and stock trading
- Fundamental vs technical analysis