Momentum Trading Strategy
In the world of forex trading, where profit potential is the ultimate goal, traders constantly seek strategies to provide them with an edge. The combination of Moving Average Convergence Divergence (MACD) and Relative Strength Index (RSI) indicators has emerged as a popular choice among the many available techniques. This article explores the MACD + RSI trading strategy and how it can be effectively employed to identify trade opportunities in the forex market.
Strategy setups
Instruments: any
Indicators: Relative Strength Index (RSI), Moving Average Convergence Divergence (MACD) with the default settings.
MACD is a momentum oscillator that consists of a signal line and histogram. The histogram represents the difference between the fast and slow EMAs, while the signal line is a smoothed version of the histogram line. When the signal line is below the histogram line, the trend is bullish; otherwise – bearish. The intersection of lines gives signals to buy or sell.
The Relative Strength Index (RSI) is a momentum oscillator that evaluates the speed and change of price movements. The RSI calculation involves comparing the magnitude of recent gains to recent losses and generating a value between 0 and 100. RSI levels above 70 typically indicate overbought conditions, suggesting a potential price reversal or correction. Conversely, RSI levels below 30 often signify oversold conditions, indicating a potential upward price movement.
Timeframe: H1 - H4
Risk management rules: 2-5% as margin from the overall balance
Rules for a long entry
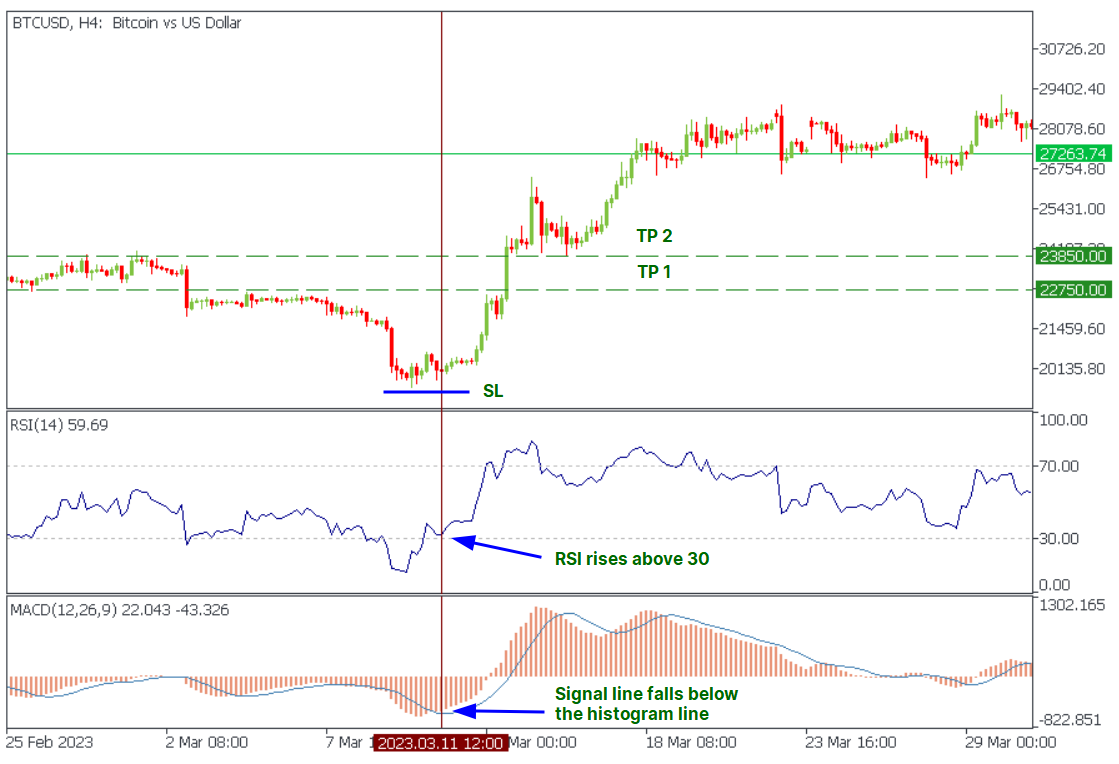
- Spot a moment when the RSI is below 30, and the MACD signal line is above the histogram line.
- Wait until the RSI rises above 30 and the MACD signal line falls below the histogram line.
- Enter a buy trade.
- Set take profit at the resistance level or when a “sell signal” occurs.
- Set stop loss according to your risk-reward ratio (1:3 - 1:5 is recommended) or below the recent low.

Rules for a short entry
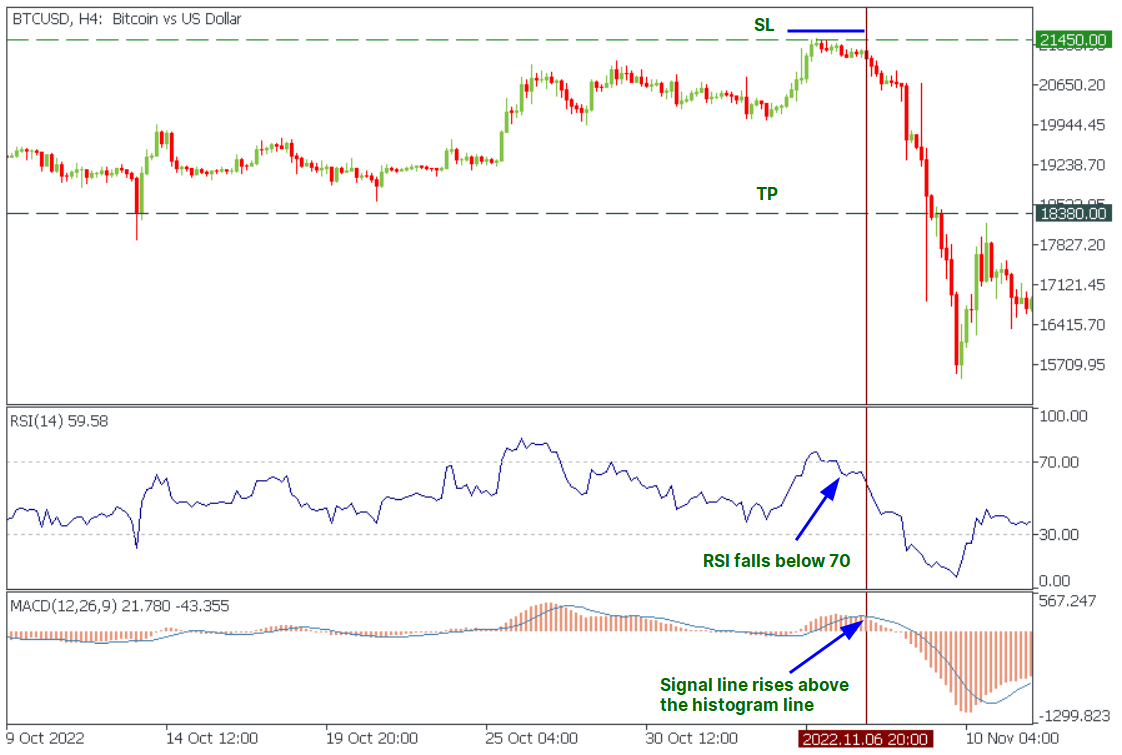
- Spot a moment when the RSI is above 70 and the MACD signal line is below the histogram line.
- Wait until the RSI falls below 70 and the MACD signal line rises above the histogram line.
- Enter a sell trade.
- Set take profit at the support level or when a “buy signal” occurs.
- Set stop loss according to your risk-reward ratio (1:3 - 1:5 is recommended) or above the recent high.

Important
Like any other strategy, combining MACD and RSI does not guarantee a 100% result. However, it is essential to follow the rules to improve the outcome.
- It is recommended to open trades following the trend. To do this, you must extend a larger timeframe and determine the general direction.
- Setting stop loss and taking profit ratios greater than 1:2 is recommended. A ratio of 1:3 to 1:5 fits the best.
Trade with FBS using MACD and RSI Oscillators and become a true professional!