Diamond chart patterns in trading
The diamond formation is a classic chart pattern. However, it doesn’t appear as often as flags, head-and-shoulders, or rectangle patterns. There aren’t many opportunities to trade the diamond chart pattern. However, technical traders should become familiar with this pattern as it provides a good trading opportunity if recognized early enough.
The diamond pattern most often occurs after an extended trend phase. During a bull market, the pattern is referred to as a diamond top or a bearish diamond pattern as the price reverses and begins a downward movement following its appearance. Conversely, the pattern is referred to as a diamond bottom or a bullish diamond pattern due to its bullish meaning when it occurs in a bear market.
The diamond chart pattern is so rare because it takes a while to form. First, it must form the support and resistance lines, diverging at strong angles to the horizontal lines, then converging again in one structure, ultimately resulting in the diamond shape after which it’s named.
The chart below shows the GBPUSD diamond chart pattern from June 7, 2019.
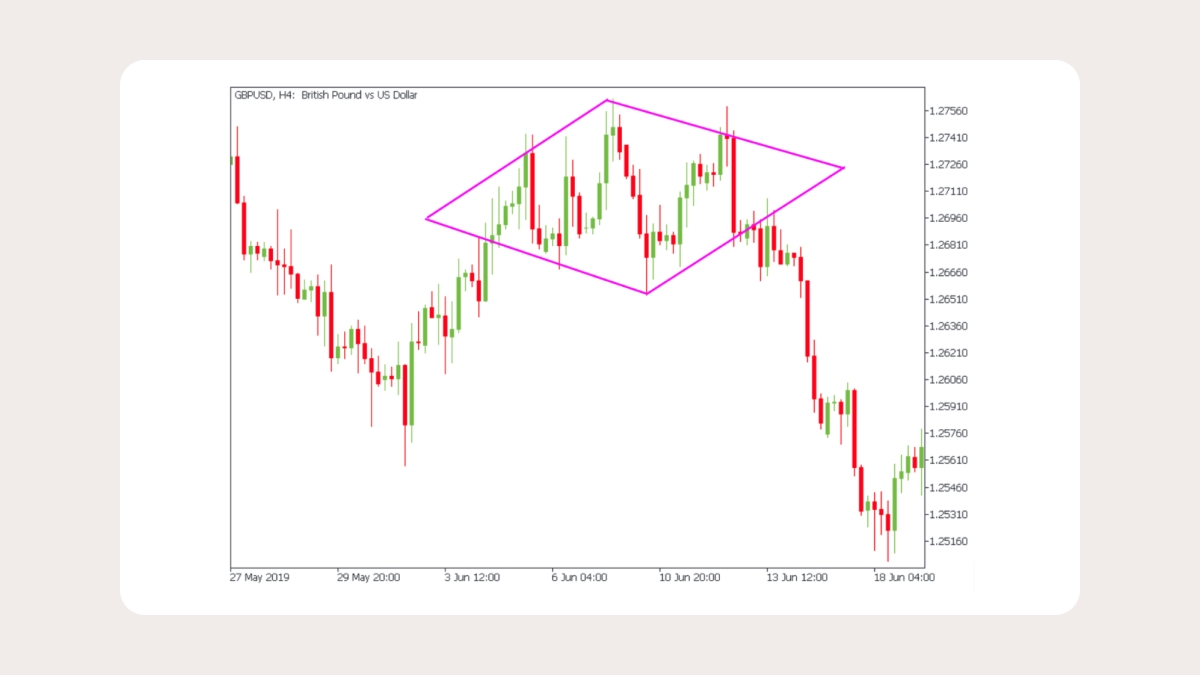
In reality, the patterns are not as neat and even as in the diagrams. But if the pattern conforms to the logic of both highs and lows and has a more or less rhomboid shape, it’s a diamond.
Bearish diamond pattern
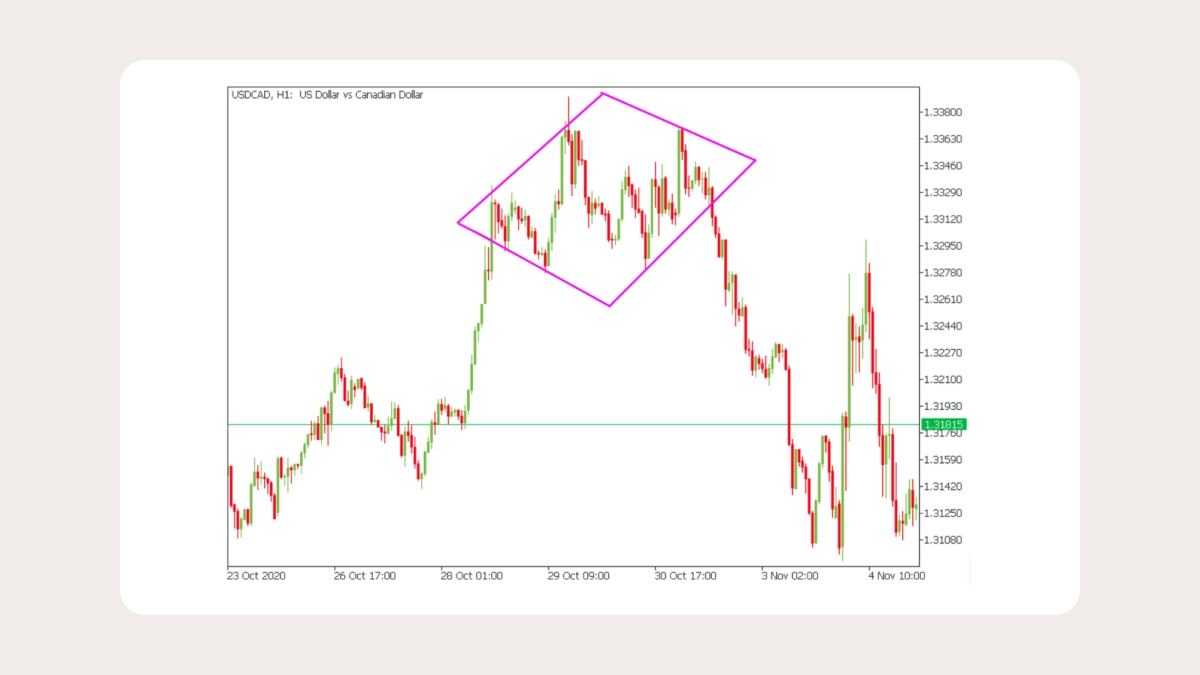
A bearish variation known as the diamond top was described in the previous section. Traders can view this pattern as a series of up-and-down price swings that resemble a head-and-shoulders structure.
Specifically, the left shoulder and the head will join to form a trend line, while the head and right shoulder will form a second trend line. It completes the trend lines for the top of the bearish diamond formation, then, for the bottom part, we connect the swing lows inside the troughs, forming a V-shape.
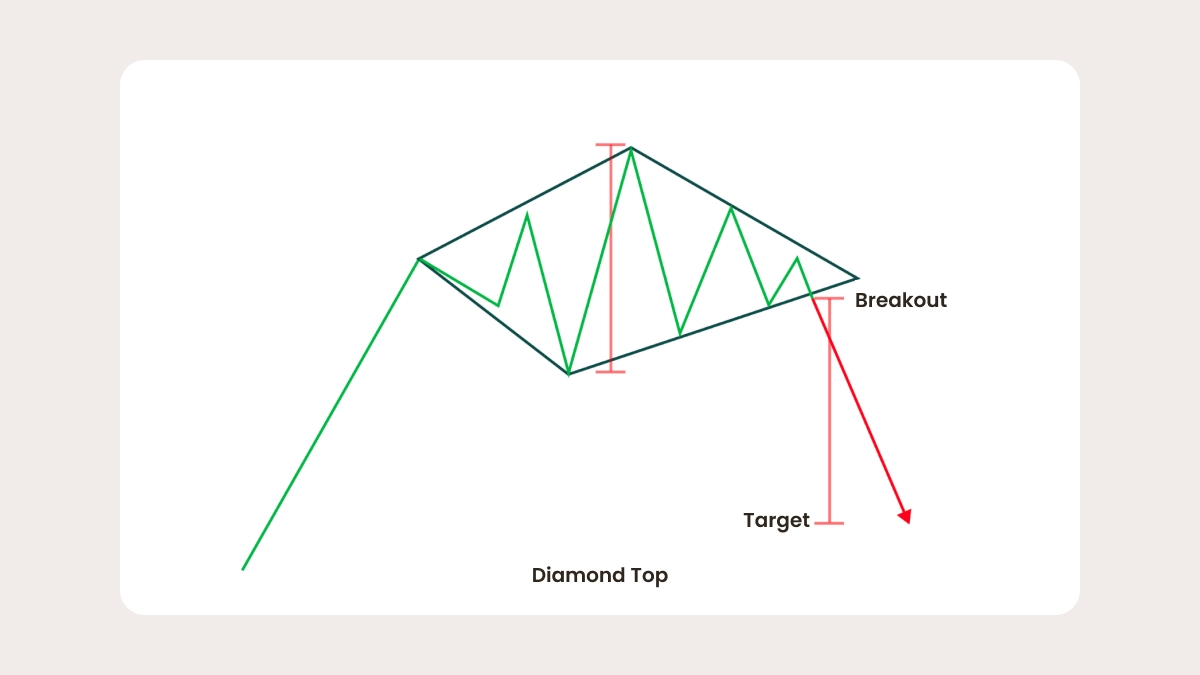
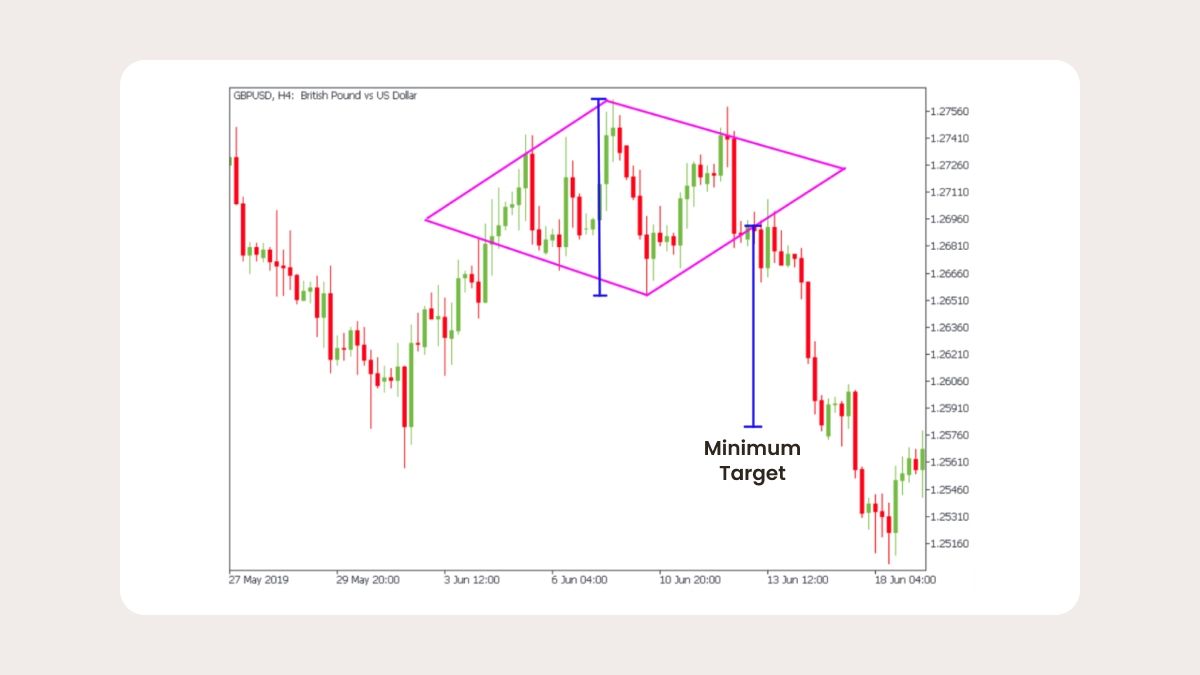
The illustration above shows us the bearish diamond pattern again. This chart shows a breakout entry signal for trading the diamond structure and a target level for the pattern. The short entry signal will be triggered by the breakout and close below the lower right line slanting upward.
Some traders prefer to wait only for a break below this line without requiring a close below it. This is a possible entry point; however, be aware that it will result in more false signals than waiting for a breakout and a close.
The target price for the structure is calculated using the measured movement method. Specifically, we want to measure the distance from a peak to a trough within a structure and then project that distance down from the breakout point. It will provide a level where we can expect the continuation of the breakout to begin to wane or possibly reverse. Thus, it represents an excellent take-profit and exit level.
Bullish diamond pattern
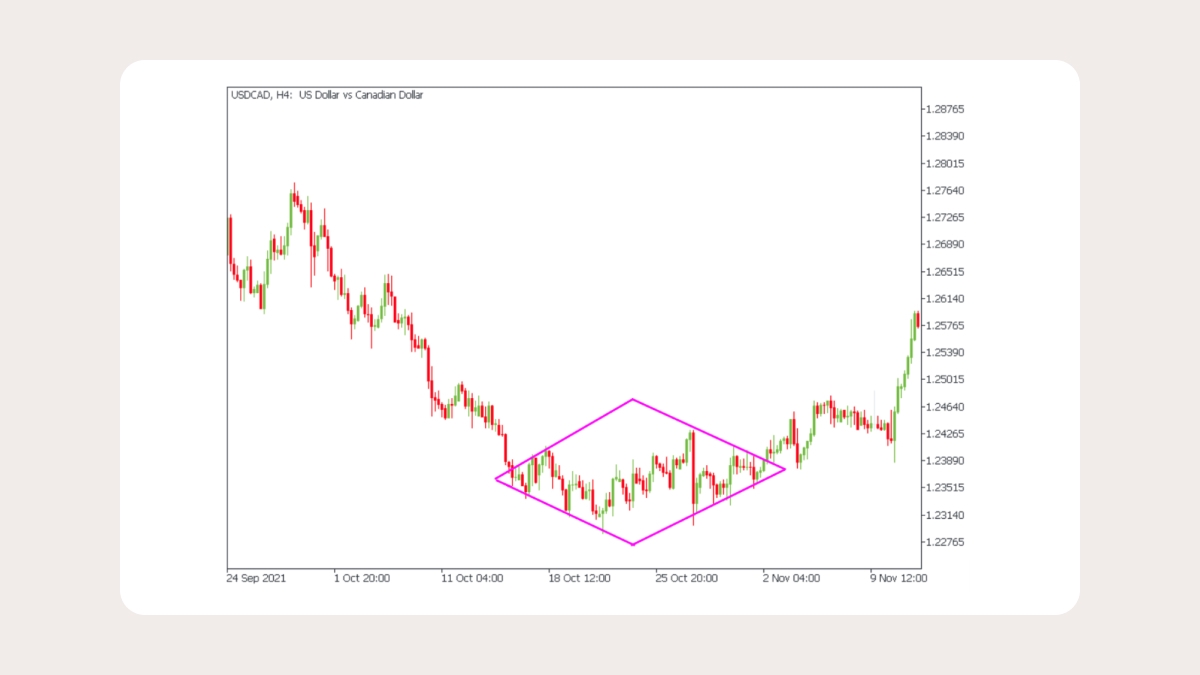
Now let’s look at the opposite of the bearish diamond, which is a bullish diamond. A bullish diamond pattern, called a diamond bottom, occurs after a downtrend. We usually see a substantial downward price move, followed by a consolidation phase that carves up and down swing points on a diamond bottom.
In this case, the appearance will resemble an inverted head and shoulders pattern. We will connect the peaks and troughs within the structure in the same way described earlier. Once we draw four trend lines around the structure and confirm that the four lines are roughly equivalent in size, we can confirm the structure as a bullish diamond pattern.
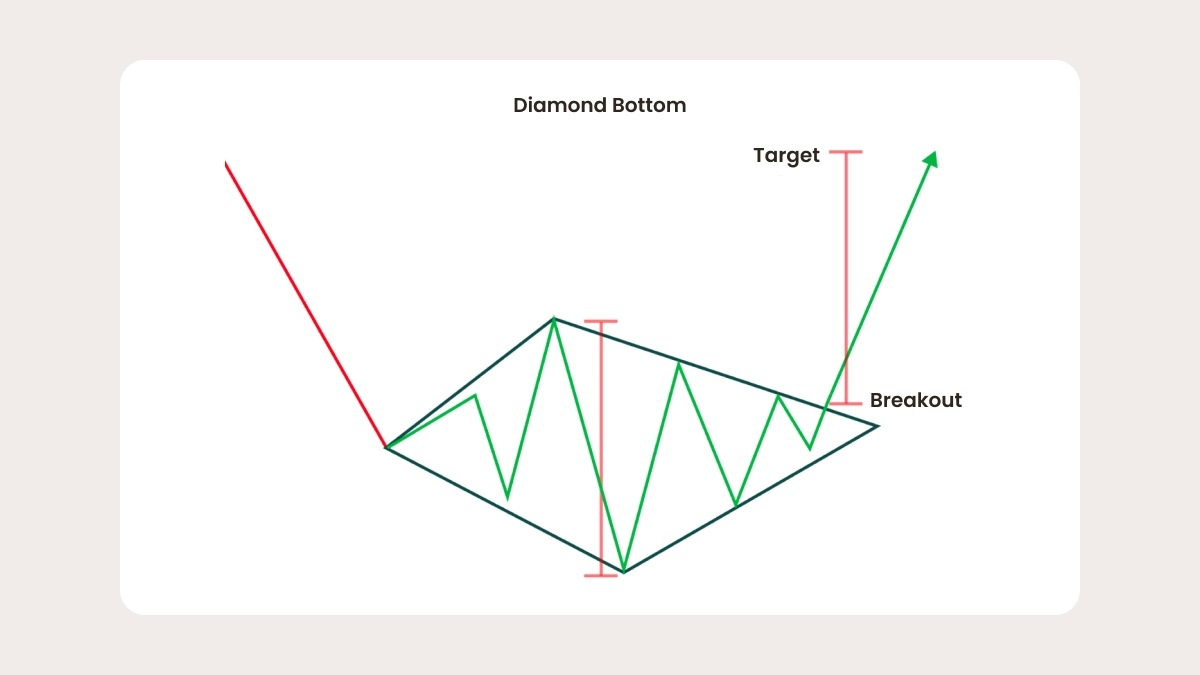
Looking at the diamond bottom illustration above, we see that a downward price move precedes the formation. An ascending sequence in a diamond structure is outlined by two upper trend lines pointing down and two lower trend lines pointing up.
A break and close above the upper right line with a downward slope triggered the signal to open a long position. Again, the preferred method would be to wait for an actual breakout and close rather than just a breakout above this trendline. This will help prevent false signals and potential price movement around this area.
Calculating the upper price target is accomplished by measuring the high and the low inside the closed structure. Once we calculate this distance and plot it on the chart, we’ll extend the same distance from the upward projected breakout point to reach our preferred target level. Once the price reaches this level, we should consider closing the entire position, or at least a large part of it, and possibly leaving a smaller part open if necessary.
What is a diamond continuation pattern?
Even though diamond chart patterns are widely considered reversal, they can surprise traders. Not all diamond patterns change the trend direction, so it’s essential to remember that diamond continuation patterns also exist.
A diamond continuation pattern happens when the price breaks out of a consolidation period in the same direction as the primary trend. Like in reversal diamond patterns, the price creates high and low peaks but then narrows its range and, after a while, goes back on track in the same direction as the main trend.
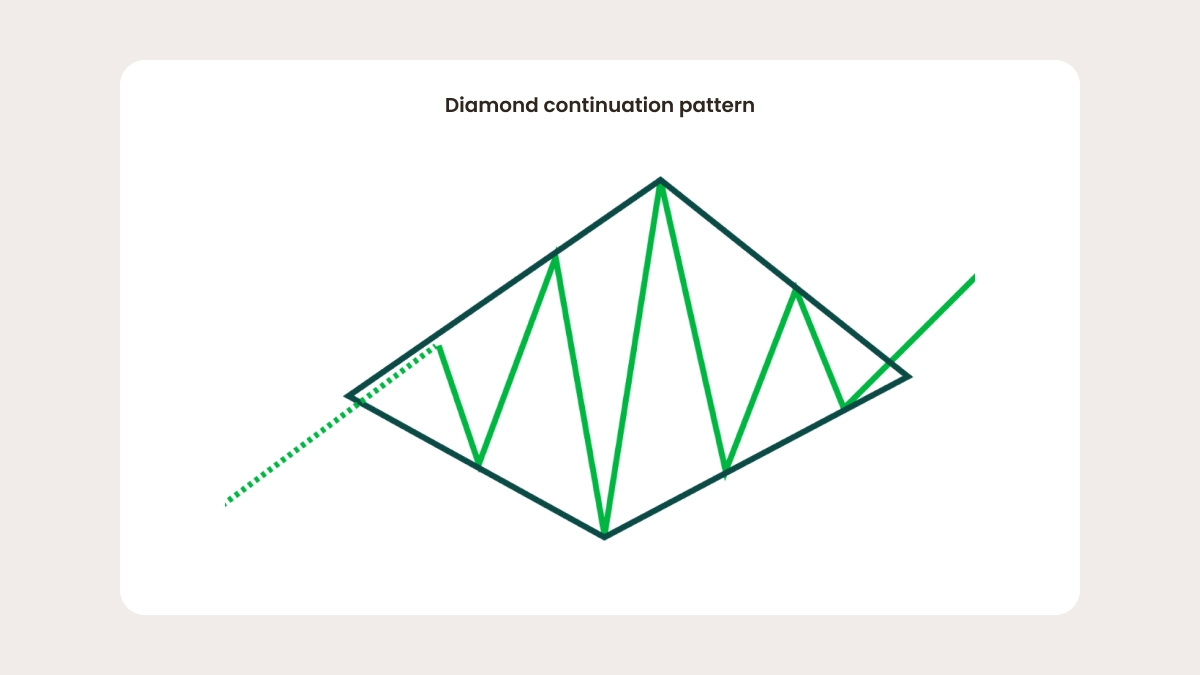
A diamond continuation pattern also takes a lot of time to develop and take shape, so you have enough time to use other methods and tools to see whether the trend reversal is likely or if the price will continue in the same direction.
Pitfalls of the diamond pattern
Unfortunately, no pattern can predict market price movements with 100% accuracy. Diamond chart patterns don’t always predict trend reversals. Sometimes, the price can break out and continue moving in the same direction as before. So it’s essential to wait for a reversal confirmation or use other methods to gain more insight into the momentum.
.jpg)