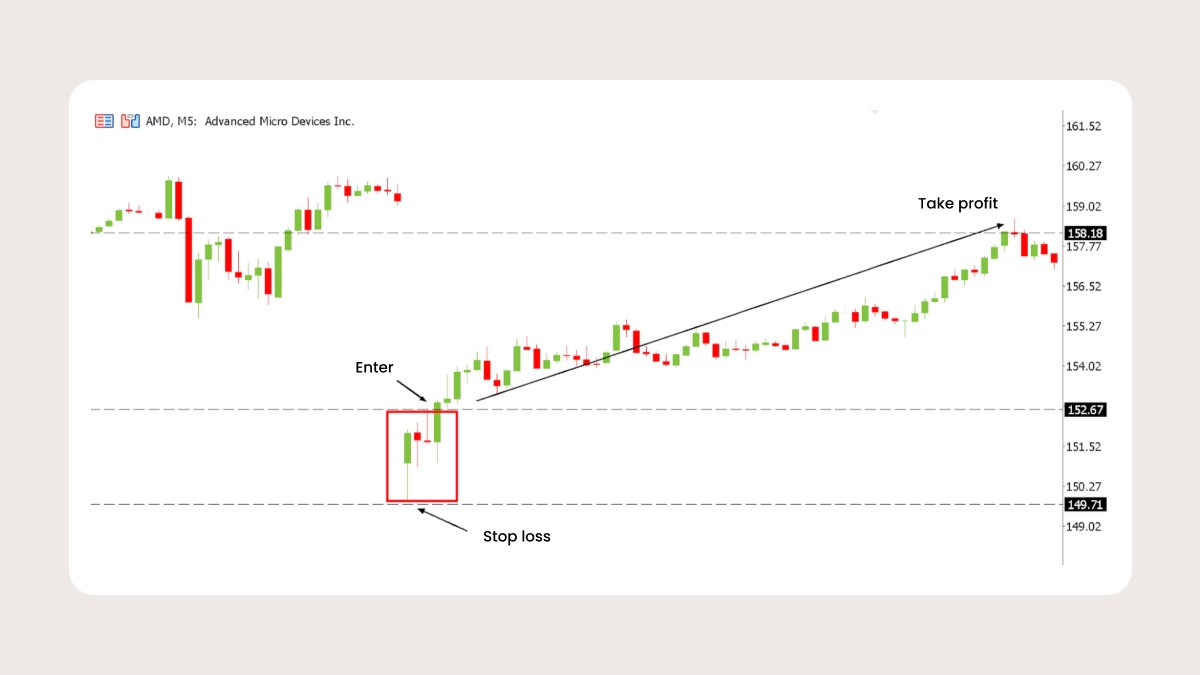
Bullish ORB example:
On this 5-minute chart, AMD opened and quickly formed its first 15-minute range between roughly $149.70 and $152.67 (as shown in the red box). This zone was the first battle between buyers and sellers.
At 09:45 ET, the price broke above the range high of $152.67 on strong buying pressure (see entry arrow). This breakout confirmed bullish momentum, giving a clear signal to go long. A protective stop-loss was placed just below the range low at $149.70, limiting downside risk.
From there, AMD steadily trended higher throughout the session, reaching the $158.18 level by late afternoon (see take-profit arrow). This offered traders a nearly 2:1 reward-to-risk ratio.
Takeaway: A bullish ORB setup is triggered when price clears the opening range high on volume. With stops set below the range and targets at logical resistance levels, it gives traders a structured way to play early upside momentum.
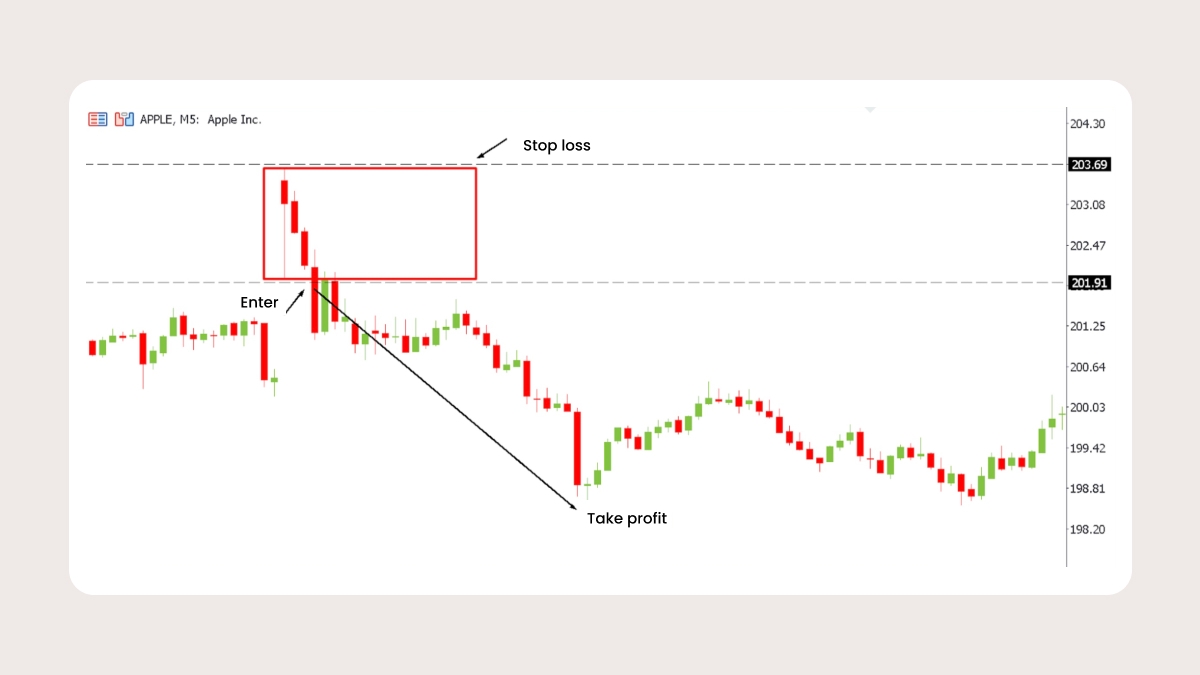
Bearish ORB example:
On this 5-minute chart, Apple opened and set an initial range between about $201.91 and $203.69 (see red box). This range showed the morning balance between buyers and sellers.
Once the price broke below $201.91, sellers took control, offering a short entry opportunity. The stop-loss was placed just above the range high at $203.69, keeping risk under control.
From there, the price trended lower into the $198.50 zone (see take-profit arrow). This move returned about 1.5R relative to risk, making it a straightforward example of a bearish ORB.
Pullback entry after breakout
Not every opening range breakout plays out cleanly. Here’s a common trap:
On this 1-minute Apple chart, the opening range is highlighted in red. The price initially broke above the range, but the volume never picked up — the bars below show volume staying flat, which was an early warning sign.
Soon after, price slipped back inside the range, confirming a failed breakout. This created a short trade opportunity at the re-entry point (Enter), with a stop just above the failed high (Stop).
From there, momentum shifted lower:
Target 1 was the midpoint of the range, where partial profits could be taken.
Target 2 was the opposite side of the range, completing the failed ORB.
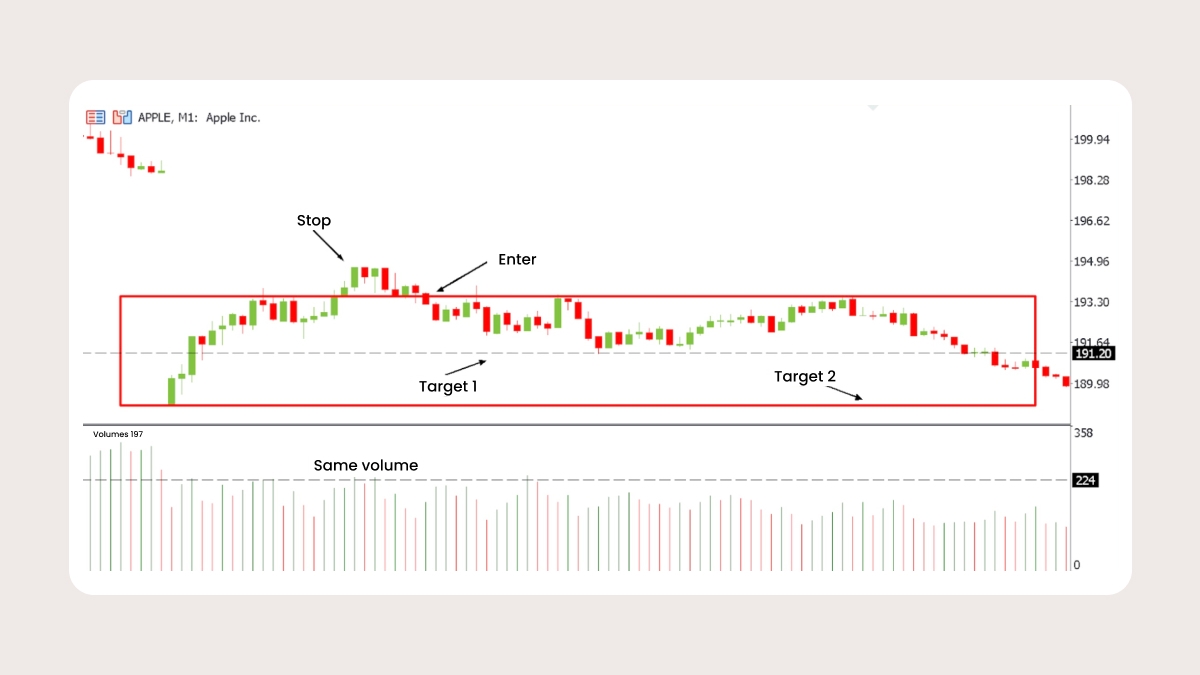
Takeaway: when the price breaks the opening range without volume confirmation, the breakout often fails. Spotting this lets you trade the reversal with clear risk and reward levels.
Backtesting & expectations
Before applying the ORB strategy with real capital, it’s important to test it out on past data. Use at least 1-minute intraday data to capture the opening range and breakout mechanics accurately. Define a fixed testing protocol:
Time windows: Test different opening ranges (first 5, 15, or 30 minutes) to compare sensitivity.
Range filters: Set minimum range thresholds (at least 0.2% of price) to filter out weak signals.
Exit logic: Compare outcomes using fixed targets, trailing stops, and time-based exits.
Volume confirmation: Track whether trades with above-average volume worked better.
Expect that results will vary by ticker, market cycle, and volatility regime. No backtest will give you a perfect equity curve. The point isn’t to find a magic formula that never fails, but to understand how the strategy works out in different conditions. You can then use that knowledge to trade with realistic expectations and find which versions (bullish, bearish, failed ORB, pullbacks) fit your style best.
FAQ: Opening Range Breakout trading
When is the best time window for ORB trades?Most traders use the first 15–30 minutes after the market opens (09:30–10:00 ET). That’s when volatility and volume peak, and the opening range forms clearly.
How do you handle large opening gaps?If a stock gaps far beyond the prior day’s range, be cautious. Gaps often lead to fake breakouts. Wait for volume confirmation or look for the first pullback to enter instead of chasing the initial move. (See Variants section).
How long should I hold an ORB trade?There’s no fixed rule. Many traders hold for 30–90 minutes or until the breakout loses momentum. Others exit by the end of the session if trading intraday only. Use fixed R targets, time-based exits, or partial profits as part of your plan (see Risk Management section).
Can I backtest the ORB strategy?Yes. Use 1–5 minute historical data to simulate trades. Test different opening windows (15 vs. 30 min), range filters, and stop/target rules. Avoid overfitting, which is when you design the strategy too specifically for one stock or period. (See Backtesting & Expectations).
Is ORB suitable for small accounts?Yes, if you keep risk small (for example, 0.5% of your account per trade) and trade liquid stocks to avoid slippage. Smaller accounts benefit most from tight stops and high-liquidity tickers. (See Position sizing frameworks).
ORB terms explained
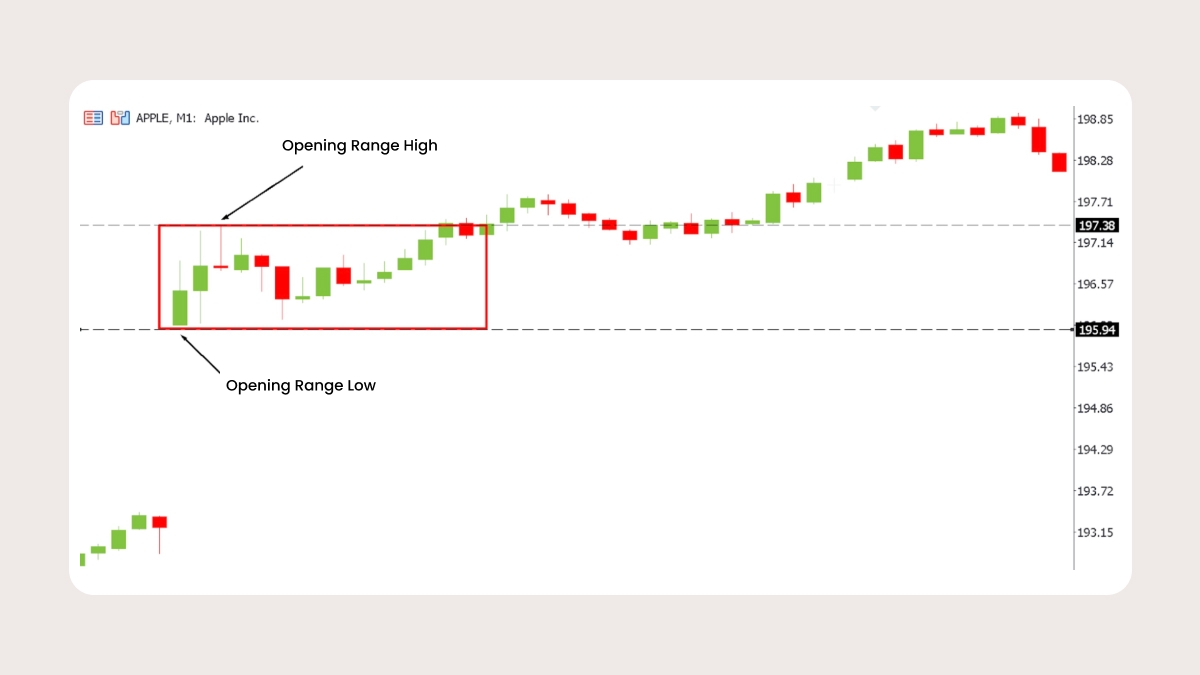
Opening Range (OR): The high and low during the first 15–30 minutes after the open. It forms the basis for breakout signals.
Opening Drive: A strong move right after the open that sets the tone for the day.
Gap: A price jump between the prior day’s close and the current day’s open. If the gap is too large, ORB breakouts may be less reliable..
Range Width: The distance (in price or %) between the opening high and low. Used as a filter to ensure the setups are tradeable.
Midpoint: The 50% level of the opening range. Sometimes used for stops or intraday support/resistance.
Failed Breakout (Failed ORB): When price breaks out of the opening range but quickly reverses back inside, often triggering stop losses.
Pullback Entry: Waiting for price to break out and then retrace to the breakout level or VWAP before entering.