Apr 04, 2025
Strategy
What Are Forex Pair Correlations and How to Trade on Them
What is currency correlation in Forex trading?Positive correlationNegative correlationWhat is the correlation coefficient?What correlation is considered strong?Highly correlated currency pairs in ForexForex correlation trading strategiesExample of Forex correlation tradingCorrelation in stock and commodity marketsHow to trade forex correlation pairsBottom line
Currency correlation in Forex is essential for every trader to understand because it can affect trading results without the trader’s awareness.
A correlation is a mutual relationship between two or more things. In Forex, a correlation is a connection between currency pairs that reveals to what extent they move in one direction. The stronger the correlation is – the more related their price charts are. There are two types of correlation: positive and negative.
Positive correlation
A positive correlation means that two pairs move in the same direction.
Negative correlation
A negative or inverse correlation means that two pairs move in the opposite direction.
Note that if the pairs move randomly with no visible connection, that means there is no significant correlation between them.
What is the correlation coefficient?
A correlation coefficient is a measurement that demonstrates how strong or weak a correlation between currency pairs is. The coefficient ranges from -1.0 to +1.0. You’ll hardly ever see exact -1.0 and +1.0 figures — numbers close to 1.0, such as 0.8 or 0.7, occur more often.
The closer a number is to 1.0, the stronger the correlation is between currency pairs (the extent to which their values are related). Alternatively, the closer the correlation coefficient is to 0.0, the weaker the relationship between currency pairs.
The ‘+’ sign shows a positive correlation, while the ‘-’ sign signals a negative correlation between pairs.
What correlation is considered strong?
If the coefficient is below -0.7 and above +0.7, the correlation between currency pairs is widely accepted as strong. Otherwise, if it is between -0.7 and +0.7, it indicates that the pairs are weakly correlated. The correlation coefficients close to 0 demonstrate that the currency pairs have no detectable relationship.
Highly correlated currency pairs in Forex
This table reveals the most traded currency pairs with strong negative or positive correlations.
Pair 1 | Pair 2 | Type of correlation |
AUDUSD | NZDUSD | Positive |
AUDUSD | GBPUSD | Positive |
EURUSD | GBPUSD | Positive |
GBPUSD | GBPJPY | Positive |
USDJPY | GBPJPY | Positive |
EURUSD | USDCHF | Negative |
GBPUSD | USDCAD | Negative |
GBPUSD | USDCHF | Negative |
USDCAD | EURJPY | Negative |
USDCAD | AUDUSD | Negative |
It is significant for every trader to monitor correlations on the Forex market.
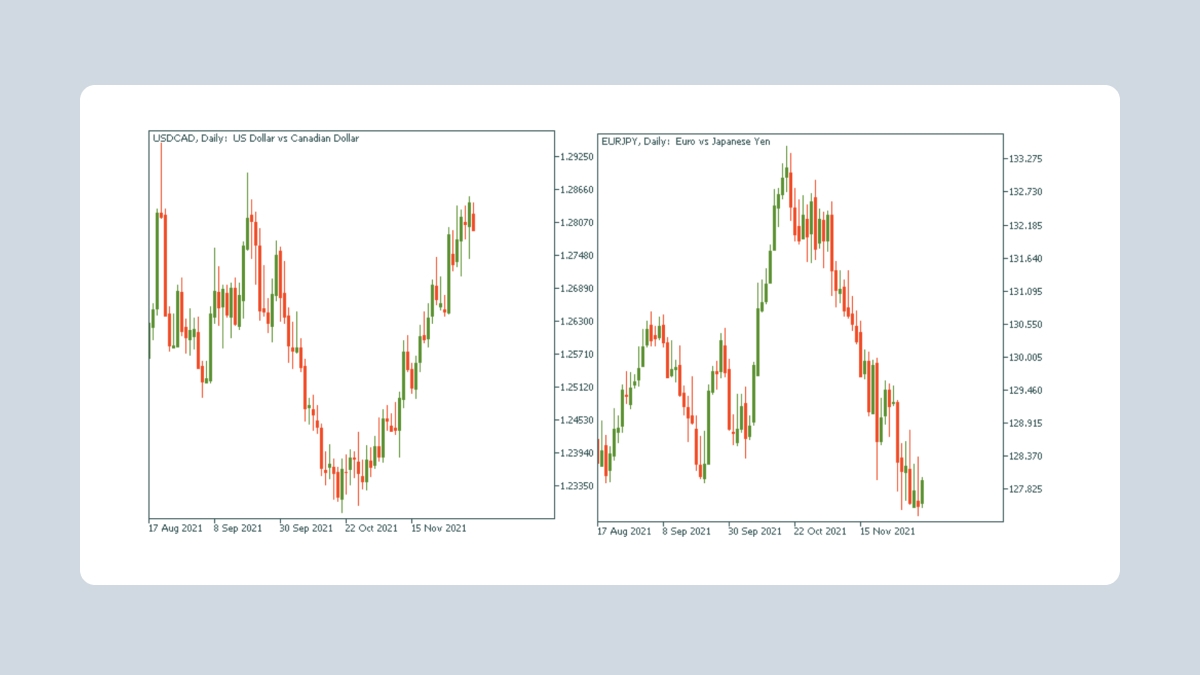
For example, traders could accidentally go long on (buy) USDCAD and go short on (sell) EURJPY thinking they have opened two different trades. But, instead, these pairs tend to move in opposite directions since these currency pairs have a strong negative correlation. In this case, the trader would open almost equal trades in opposite directions. On the one hand, the trader can win on both trades, but, on the other hand, they risk losing on both, as USDCAD and EURJPY are highly correlated.
Forex correlation trading strategies
Coping strategy
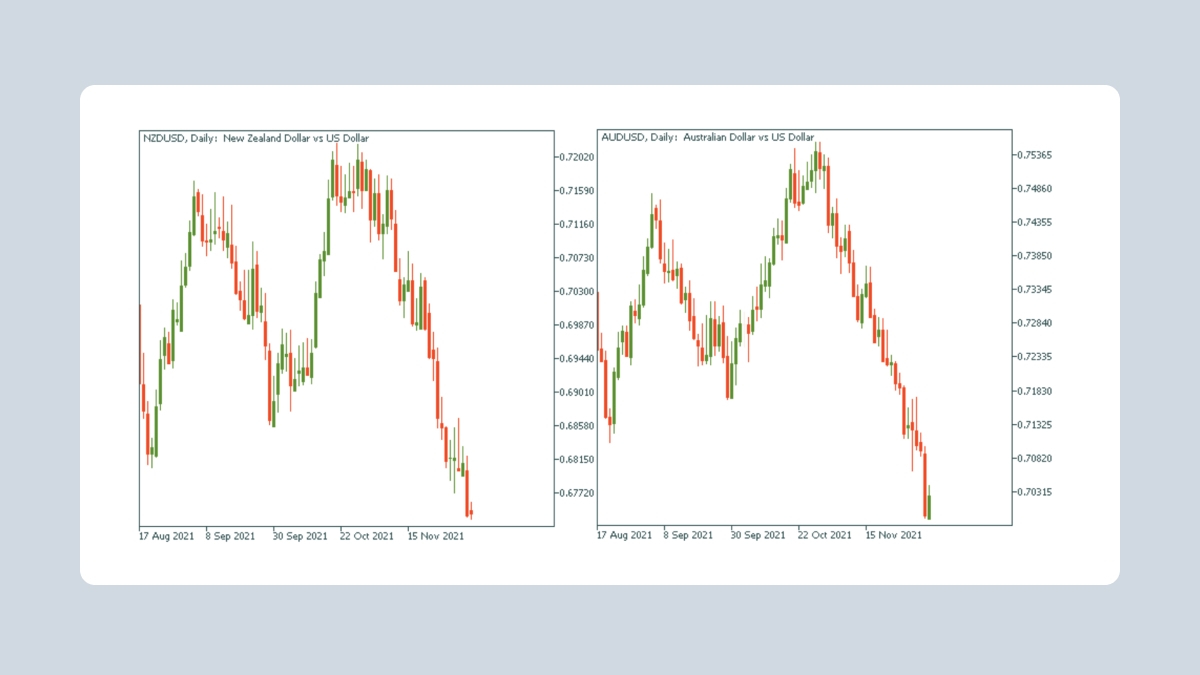
Trom the chart above, you know that AUDUSD and NZDUSD correlate positively. If you look at their price charts, you will see almost identical pictures. Here’s the trick: when one is lagging, you can predict with great probability its future movement simply by looking at its twin.
Double-check strategy
If you open orders with correlated pairs, be cautious as you can increase the level of risk you take. For example, let’s say you buy two currency pairs that are positively correlated: AUDUSD and NZDUSD. If your forecast is correct, you will get a double profit. However, if the price goes against your expectations, it will also double your loss. How can a trader minimize this possible risk? Use signals from correlated pairs!
For example, if you analyze EURUSD and think it can rise, don’t open the long order immediately. Instead, make the proper analysis of the correlated pair (for example, GBPUSD) to confirm your trading signal. Then, only if the analysis of GBPUSD or any other positively correlated pair gives a bullish signal too, can you go long on EURUSD with greater confidence!
Hedging strategy
What about negatively correlated currencies? Traders can use them for hedging purposes! For example, a trader buys two currency pairs that are negatively correlated. If the forecast is incorrect and the first pair moves opposite the trader’s expectations, the second trade will offset the losses
A hedge is an investment a trader makes to decrease the risk of opposite price movements in an asset.
Taking one more trade that tends to move in the opposite direction to the first position is a hedging strategy. For example, if currency pairs are positively correlated and traders want to hedge, they should consider buying the first one and selling the second one. Alternatively, if currency pairs are negatively correlated, and traders wish to hedge, they should consider buying or selling both pairs (opening convergent orders).
Understanding correlations is one thing; and seeing how they play out on actual charts is another. That’s where FBS video tutorials come in handy.
Example of Forex correlation trading
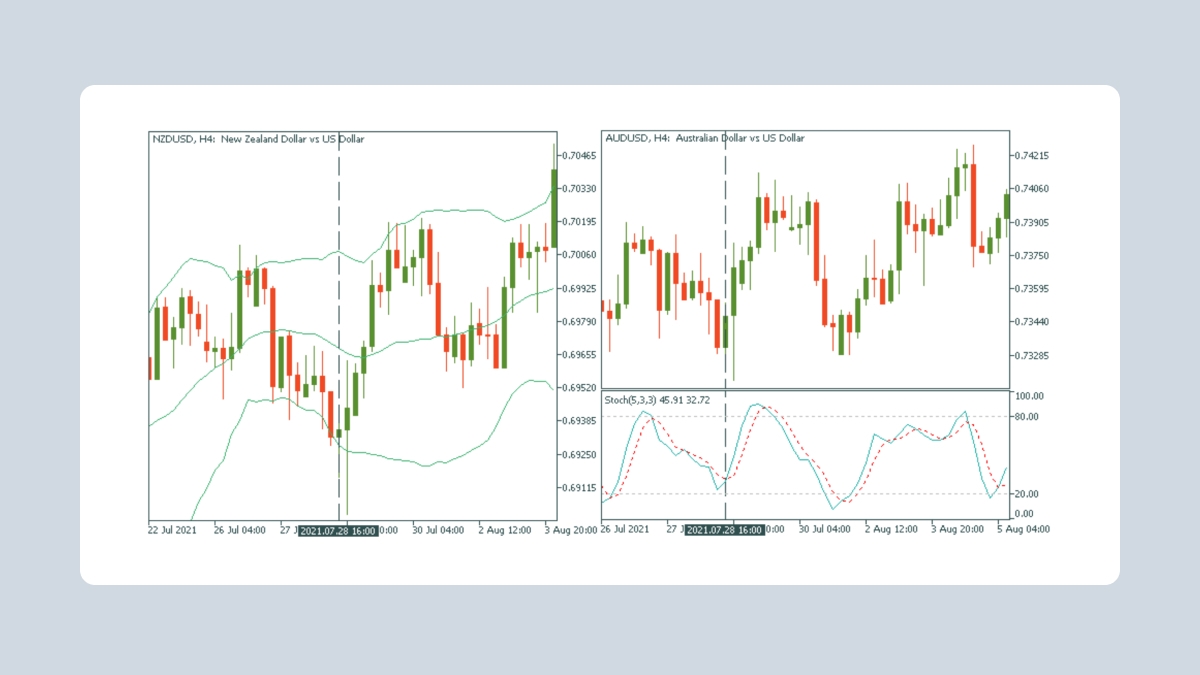
For instance, you open the NZDUSD chart and notice two signals to go long (buy): the pair dropped out the lower line of Bollinger bands, and the candle formed a pin bar. Then you switch to the correlated currency pair – AUDUSD. Great! It shows the signal to buy too: the signal line of the stochastic oscillator crosses the dashed line from the bottom up. Using this signal, you could have gotten the double profit from NZDUSD and AUDUSD.
Correlation in stock and commodity markets
Not only currency pairs correlate, but also commodities, stocks, and stock indices!They can all correlate with each other as well as with currency pairs.
For example, gold (XAUUSD) tends to have a negative correlation with the US dollar and a strong positive correlation with silver (XAGUSD).
Meanwhile, crude oil (XBRUSD and XTIUSD) positively correlates with the Canadian dollar as Canada is the largest oil supplier to the US. Thus, when oil rises, CADJPY tends to go up, while USDCAD tends to go down.
Besides, US stock indices such as S&P 500 (US500) and Nasdaq 100 (US100) have a strong positive correlation. Moreover, cryptocurrencies such as Bitcoin and Ethereum have a high positive correlation. Finally, speaking about stocks, when one large-cap stock rises, all other similar stocks from its sector move up too.
How to trade forex correlation pairs
You’ve learned various approaches to using correlation. To start trading correlated assets, follow these steps:
Download the FBS app or MetaTrader 4/5.
Open an account in the FBS app or an MT5 account in your Trader Area. Make a proper market analysis and choose an asset of your interest: currency pair, stock, or commodity.
Choose a strategy from above and pick a correlated asset.
Manage your risk properly with special tools such as Stop Loss and Take Profit orders, which can be especially useful in times of high volatility on the markets. Remember, though these tools do not protect you 100%, they help you minimize the possible risks.
Open an order and monitor it!
Bottom line
It is crucial to know how various currency pairs correlate with each other. As explained above, some currency pairs and other assets move in one direction, while others – in opposite directions. Understanding correlation in the financial markets helps traders manage their risks more appropriately and gives a powerful tool to increase profit!
For beginners
If you are new to trading, a demo account will be a perfect start for you as it allows you to practice trading without any risk. When you open it, you will get 10 000 virtual dollars. Also, note that the minimum deposit at FBS starts from just $5 on real accounts. You can start a trading career with very little money, and limit your risks while getting a real chance to get profits on a real account!
What is currency correlation in Forex trading?Positive correlationNegative correlationWhat is the correlation coefficient?What correlation is considered strong?Highly correlated currency pairs in ForexForex correlation trading strategiesExample of Forex correlation tradingCorrelation in stock and commodity marketsHow to trade forex correlation pairsBottom line