July 11, 2025
Strategy
Bearish Engulfing Pattern: Definition, Signals, and Trading Strategies
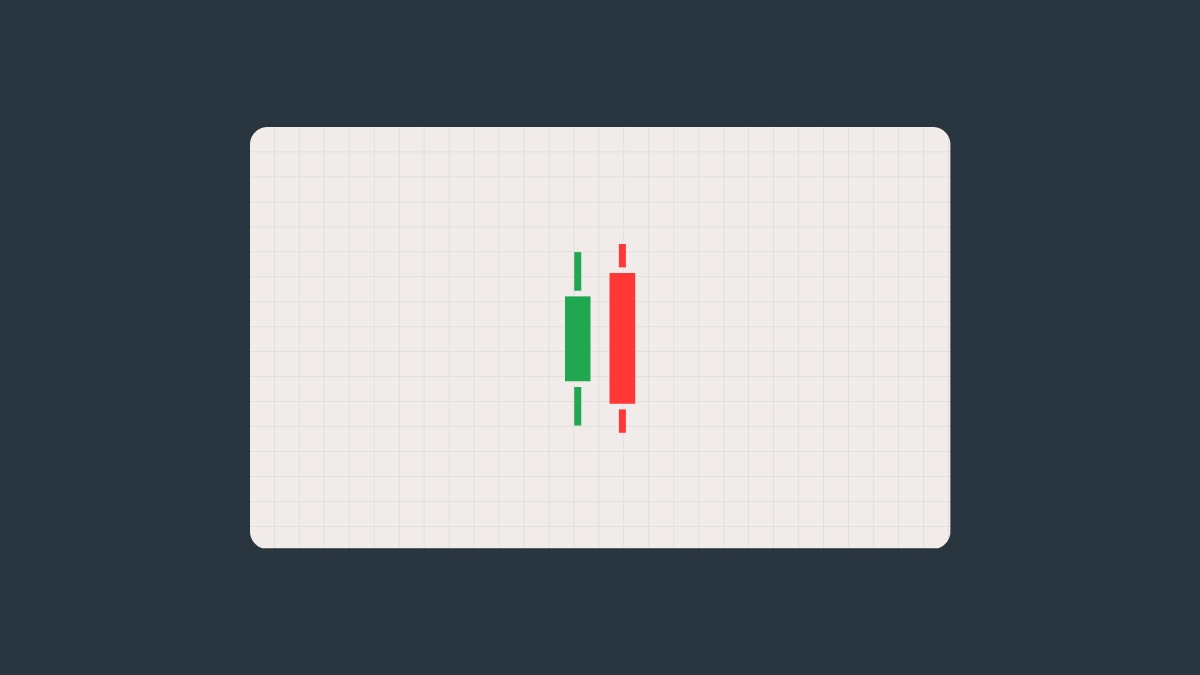
The bearish Engulfing Candlestick is a two-candle reversal pattern that forms at the end of an uptrend. It is a powerful reversal candlestick pattern consisting of two candlesticks: one bullish (closes higher than it opens), the other bearish (closes lower than it opens and completely engulfs the entire body of the bullish candlestick).
Here’s what it looks like on a chart:

Bearish Engulfing Candlestick Pattern on a chart
Want to trade different patterns like a pro? Join FBS for smarter returns.
What does it signal?
The bearish engulfing candlestick typically indicates:
Potential for a correction or trend reversal.
That buyer momentum might be fading, and sellers are starting to take control.
A good potential entry point for short positions, especially if other signals agree.
Note: it’s only a probable reversal, not a guarantee. Treat it as a signal, not a certainty, and never rely on only one indicator when making a decision.
For example, suppose NVIDIA Corporation stock (NVDA) has been in an uptrend for some time. Then it opens at $159 and closes at $164 (a bullish candle). The next day, it opens higher at $166 but sellers take over, and it closes at $157 (a bearish candle). This second candle completely overlaps the previous day's body: a textbook bearish Engulfing pattern.
If the next day the stock opens and trades lower again, that would be a confirmation of the pattern, so we can suggest a potential trend reversal or a short-term correction.
How to use the bearish Engulfing Pattern in trading
Here’s a quick step-by-step guide on how to use the bearish engulfing candlestick.
Step 1: spot the pattern
This was covered above. If you’ve spotted a bearish engulfing candlestick, don’t jump right into the trade.
Step 2: wait for confirmation
The next candle after the pattern forms should also be bearish. If this coincides with a breakout of the local maximum, it is the ideal entry point for a breakout.
Step 3: look at other indicators
It’s always a good idea to combine several indicators to confirm a trend direction. To boost your chances, look to the following tools:
RSI (Relative Strength Index) above 70 (overbought).
A decrease in volume during the bearish Engulfing candle.
A so-called “death cross” (a short-term moving average (MA), usually a 50-day MA, crossing below the long-term moving average, usually a 200-day MA).
Step 4: set entry and exit strategies
Enter the trade only after solid confirmation. Remember that stop-losses and take-profits are every trader’s friends: set a stop-loss right above the formed pattern to limit the risks, and a take-profit at the nearest support level or FVG (Fair Value Gap) to protect the results.
Common mistakes when trading the bearish Engulfing pattern
Entering too early: always wait for reliable confirmation from several tools.
Trading during a sideways market: this pattern is more reliable in clear uptrends.
Ignoring volume: volume tells you whether there’s real conviction behind the pattern.
Forcing it: not every large red candle is an engulfing candle. Stick to the criteria.
Not enough experience in technical analysis? Don’t worry, open an FBS demo account and try trading risk-free.
FAQ
1. Does the bearish engulfing pattern always work for reversals?
No, It’s a sign of a probable reversal, not a guarantee. Always look for additional confirmation.
2. On which timeframes does it work best?
The pattern is more reliable on higher timeframes: daily, 4H, weekly.
3. Does it work in a sideways market?
Not really. The bearish engulfing candlestick is much more effective in an uptrend, where there’s actual momentum to reverse.
4. Is confirmation necessary?
The confirmation is always necessary: the probability of success increases significantly when the next candle and other indicators confirm the reversal.
5. Is it possible to trade only using this pattern?
Don’t rush it. The pattern should be part of a broader strategy that takes technical indicators, volume, and risk management into consideration.
Build your trading strategy and grow your wealth with FBS. Start now:
Open an FBS account
By registering, you accept FBS Customer Agreement conditions and FBS Privacy Policy and assume all risks inherent with trading operations on the world financial markets.