FBS turns 16

Unlock birthday rewards: from gadgets and dreams cars to VIP trips.Learn more
Open account
Open accountLog In
Open account

July 29, 2025

Strategy

What Is the Bullish Harami Candlestick Pattern in Trading?

Bullish Harami

If you’ve been trading for a while, you’ve probably come across all the popular indicators like the RSI or MACD. These are useful tools, but traders often overlook one factor: price action, and that’s where candlestick patterns can help. There’s a simple yet underrated reversal signal: the Bullish Harami Candlestick. Let’s break down what it is, why it matters, how to spot it, and how it differs from other patterns.

Why pattern recognition still matters

Advanced indicators like the RSI and MACD are valuable, but, unfortunately, they have one drawback: they’re lagging behind the actual price movements. Candlestick patterns, on the other hand, often show a change in momentum even before indicators confirm it. They are easy to learn and apply, especially when combined with key levels or indicators.

One of these patterns, the Bullish Harami, is a great example of this kind of simple reversal signal.

What is a Bullish Harami candlestick pattern?

What it looks like

The Bullish Harami candlestick is a two-candle reversal pattern appearing at the bottom of a downtrend. The first candle is a large bearish one, followed by a small bullish candle entirely within the body of the first one.

It looks like the big red candle is “pregnant” with the smaller green one, which is why it’s called Harami (“pregnant” in Japanese).

What it signals

The big red candle shows that the sellers were in control, but the next day (or period), the price opened higher and closed slightly up: the buyers stepped in, and the sellers couldn’t drive the price lower. So basically the idea behind the Bullish Harami is that sellers are losing momentum, and buyers may take action.

Important: don’t mistake the Bullish Harami for an Inside Bar. An Inside Bar is a smaller range within a larger candle, but it doesn’t necessarily indicate a shift in momentum. The Bullish Harami provides you with more insight in the context of a downtrend and also points at sentiment change.

Need more information on the main patterns? Read the FBS article Common Trading Chart Patterns You Should Know.

How to identify the Bullish Harami pattern on a chart

Here are four steps to spot the Bullish Harami on a chart.

  1. Look for it in a clear downtrend: after strong bearish moves, ideally in oversold conditions. A series of lower highs and lower lows is a sign.

  2. Don’t ignore additional confirmation: check that the RSI < 30 (again points at oversold conditions) or MACD divergence (price and MACD are moving in opposite directions).

  3. Remember that the Bullish Harami is stronger if the pattern forms near support or high-volume zones.

  4. Avoid this common mistake: many traders look for Bullish Harami patterns everywhere, including in sideways markets. But this pattern only works well after a strong move down, and may produce false signals in choppy markets.

Learn more about technical analysis and trade confidently with FBS!

The Bullish Harami vs similar patterns

The Bullish Harami may look similar to some other popular patterns. Let’s look at the main differences between them. It will help you distinguish a Harami from more aggressive patterns such as Engulfing, which tend to reverse more decisively. The Harami, in contrast, suggests pause, not a pivot. This makes it less aggressive, but more common, and still valuable if confirmed by other tools.

Pattern Key difference
Bullish Harami Second candle inside body of red candle
Bullish Engulfing Second candle fully engulfs first
Inside Bar Smaller range, but not always reversal
Morning Star Three-candle pattern, includes doji or small body

Trading strategies using the Bullish Harami

It’s easy to jump right into a trade, having made a decision based only on a pattern. But a solid trading strategy demands context, confirmation, and a plan: candlesticks alone can’t do the whole job. Here’s how to build a reliable strategy when dealing with the Bullish Harami.

Basic strategy: the most straightforward

Trading with indicators: filtering out false signals

There is no such thing as too much confirmation. Combine the pattern with popular technical tools.

  • RSI divergence: use it as a filter. Look for bullish divergence, where the price makes lower lows, but the RSI makes higher lows. This suggests momentum is weakening, and the Harami might be signaling a true reversal.

  • MACD bullish crossover: if the MACD line crosses above the signal line after the Harami, that’s a powerful confirmation. Combine it with volume analysis or a break of structure for even more confidence.

  • Multi-timeframe tip: if the Harami appears on H4, look for a structure break or momentum shift on M15.

  • Risk management: sadly, Harami often gives false signals. Avoid entry without confirming volume or a structure break on a lower timeframe.

Patterns are a powerful tool in trading. Another one is a reliable platform: try trading the Bullish Harami with FBS!

Real Examples of Bullish Harami in Action

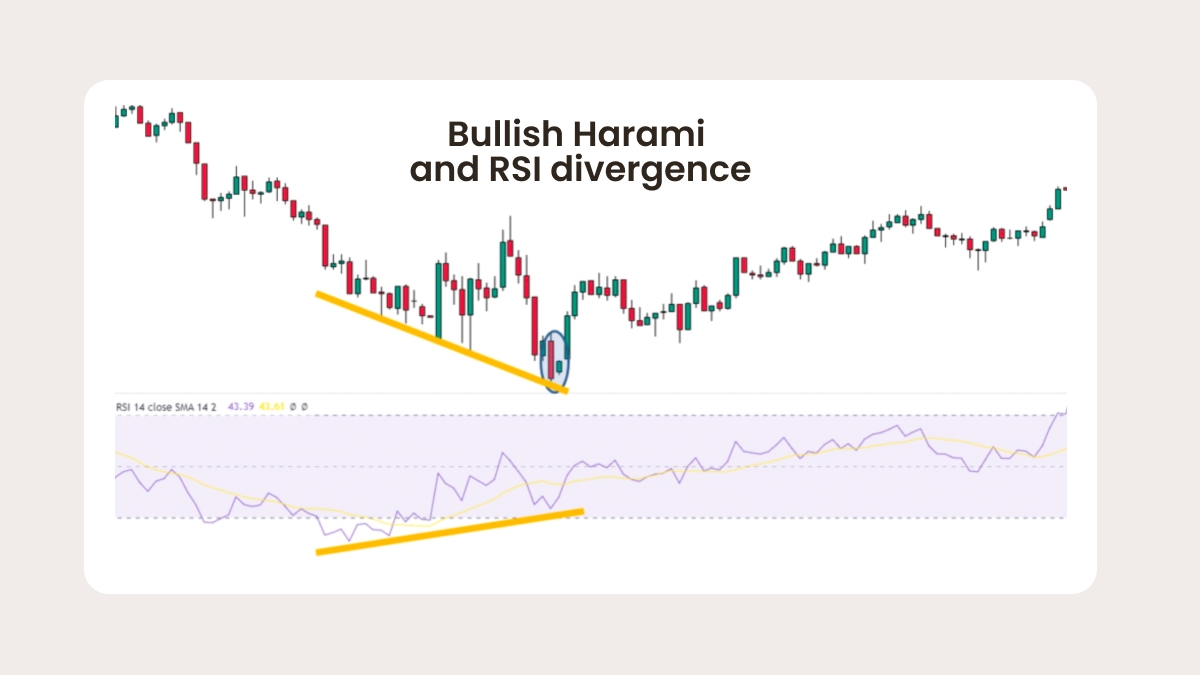
Take a look at a textbook example of a Bullish Harami Pattern.
Real Examples of Bullish Harami in Action

Here we see a long bearish candle hugging a small bullish one. But is that enough to say that it’s a Bullish Harami? No. The RSI bullish divergence confirms weakening momentum, volume spikes slightly on the green candle and a strong downtrend is obvious. Now we can be sure this is the Bullish Harami. This setup shows how the pattern can serve as an early signal of reversal when supported by broader market context — only a signal, not a guarantee. Here, both price action and indicator confirmation align, leading to a sustained move higher.

Pros and cons of the Bullish Harami

No pattern is perfect, so be aware of these pros and cons of the Bullish Harami and use them to your advantage.

Pros:

  • It’s an early signal of potential reversal, often even before indicators react.

  • It’s easy to spot on the chart, no complex tools required.

  • It works well with confluence setups (support zones, RSI divergence).

Cons:

  • Alone it can fail. There’s a high rate of false signals without confirmation.

  • It has weak momentum, because it usually signals a pause rather than a reversal.

  • It needs volume, trend context, or secondary signal for actionability. Don’t hesitate to use additional evidence for confirmation.

The Bullish Harami is a useful tool, but only with the right filters.

FAQ

Is the Bullish Harami reliable?

Don’t rely on it alone. It needs context – ideally, a clear downtrend, volume shift, or indicator divergence. Without that, it can easily fail. Always combine it with confirmation.

Can it be used on intraday charts?

Yes, but be cautious. Lower timeframes like 5M or 15M typically produce more noise and false signals. Use smaller positions or wait for confirmation from higher timeframes.

What timeframe is best?

For crypto, H1 and higher offer better structure and fewer fakeouts, while for stocks and Forex, 4H to daily charts work well for swing trading.

Bullish harami vs engulfing: which is stronger?

Engulfing patterns often trigger sharp reversals because they show full rejection of prior momentum. Harami is a softer and more cautious signal. It typically requires additional confirmation such as RSI divergence, volume support, or a key level bounce.

Summary

The Bullish Harami isn’t a holy grail, it’s an early warning signal best viewed as an alert. Go beyond patterns and build a story around them: consider the broader trend, the momentum and other filters to make a low-risk entry.

Trade on the Bullish Harami with FBS and grow your wealth. Join the community now.

Share with friends:

Open an FBS account

By registering, you accept FBS Customer Agreement conditions and FBS Privacy Policy and assume all risks inherent with trading operations on the world financial markets.

FBS at social media

iconhover iconiconhover iconiconhover iconiconhover icon

Contact us

iconhover iconiconhover iconiconhover iconiconhover icon
store iconstore icon
Get on the
Google Play
store iconstore icon
Get MT4 on the
App Store
store iconstore icon
Get MT5 on the
App Store

Trading

Company

About FBS

Our social impact

Legal documents

Company news

FC Leicester City

Help Center

Partnership programs

The website is operated by FBS Markets Inc.; Registration No. 000001317; FBS Markets Inc. is registered by the Financial Services Commission under the Securities Industry Act 2021, license number 000102/31. Office Address: The Bentley, #16 Cor A Street & Princess Margaret Drive, Belize City, Belize.

FBS Markets Inc. does not offer financial services to residents of certain jurisdictions, including, but not limited to: the USA, the EU, the UK, Israel, the Islamic Republic of Iran, Myanmar.

Payment transactions are managed by HDC Technologies Ltd.; Registration No. HE 370778; Legal address: Arch. Makariou III & Vyronos, P. Lordos Center, Block B, Office 203, Limassol, Cyprus. Additional address: Office 267, Irene Court, Corner Rigenas and 28th October street, Agia Triada, 3035, Limassol, Cyprus.

Contact number: +357 22 010970; additional number: +501 611 0594.

For cooperation, please contact us via [email protected].

Risk Warning: Before you start trading, you should completely understand the risks involved with the currency market and trading on margin, and you should be aware of your level of experience.

Any copying, reproduction, republication, as well as on the Internet resources of any materials from this website is possible only upon written permission.

The information on this website does not constitute investment advice, a recommendation, or a solicitation to engage in any investment activity.