Open account
Open accountLog In
Open account

Aug 05, 2025

Strategy

What Is the Hanging Man Candlestick Pattern and How Do You Trade It?

Hanging Man Candlestick simple steps to trade it, examples

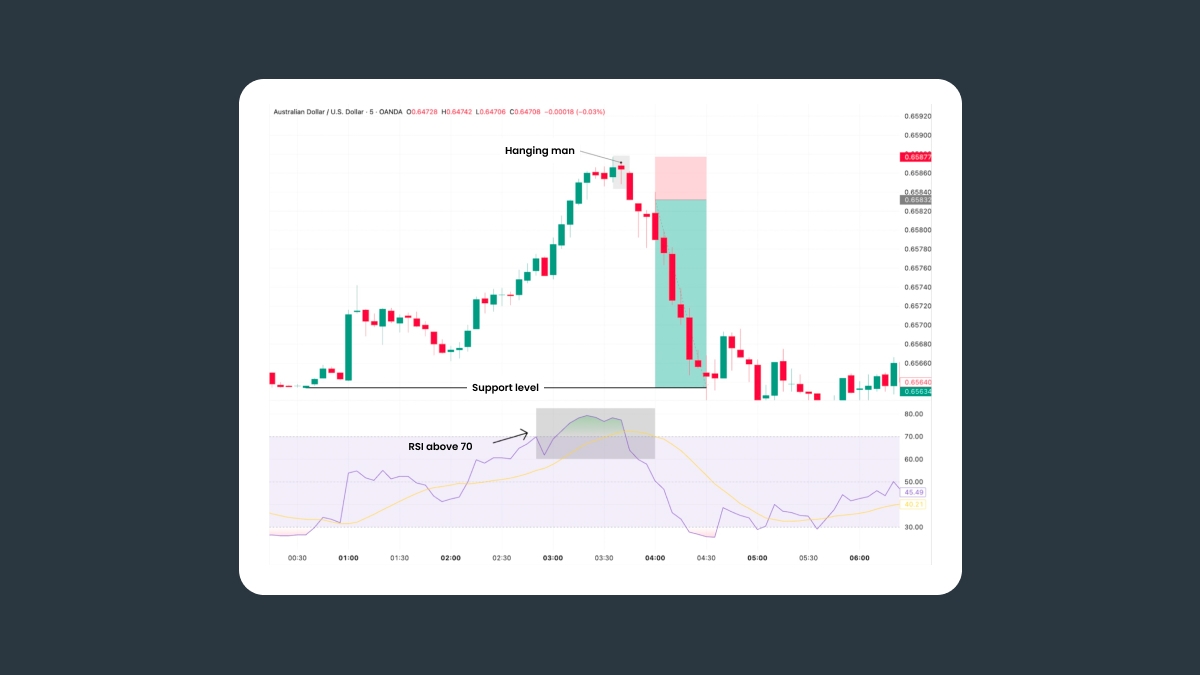
Sometimes it can be difficult for beginners to understand when to sell or buy assets. Experienced traders analyze trading signals and technical indicators for this purpose, such as candlestick patterns that show that the market will rise or fall soon. One such candlestick pattern is the Hanging Man — a pattern that appears in a bullish market as a harbinger of a transition to a bearish trend.

The Hanging Man candlestick’s meaning and significance

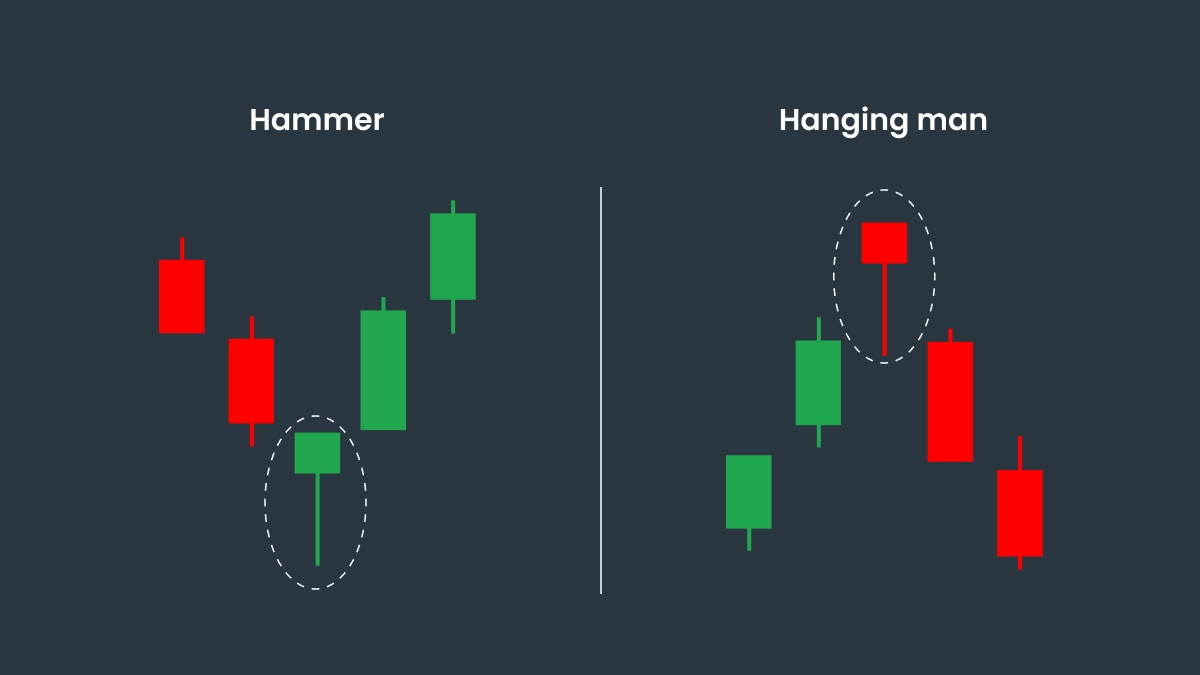
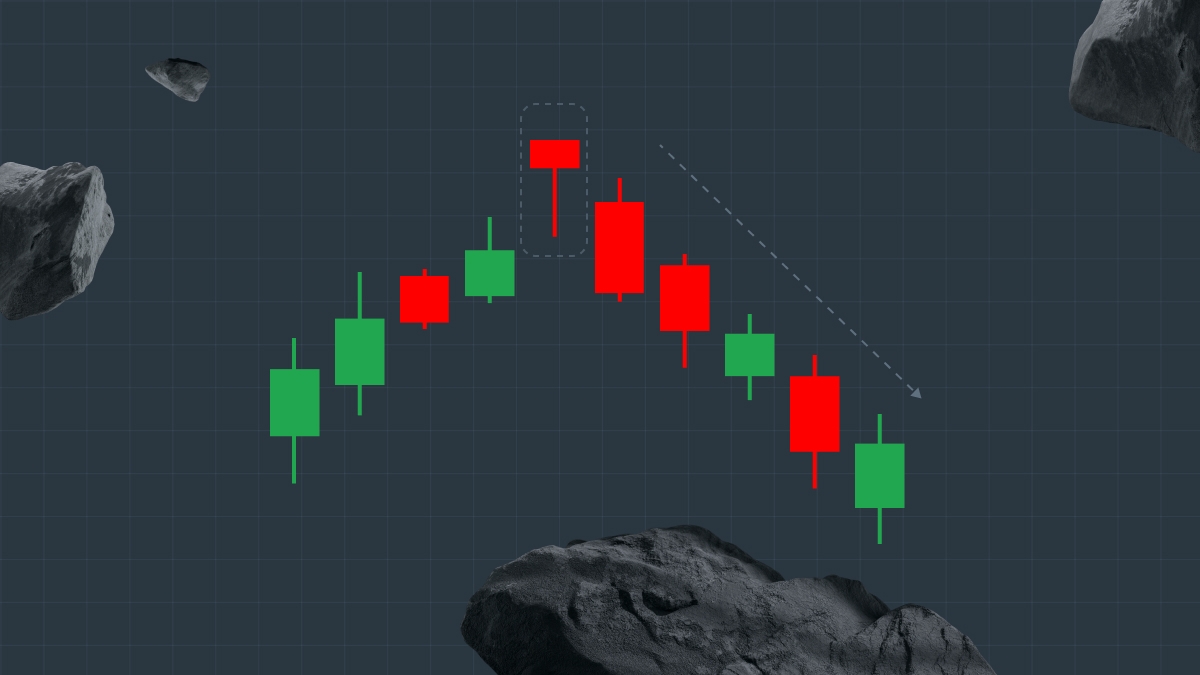
The Hanging Man is a pattern that appears at the peak of an uptrend. It serves as a warning sign that the market is about to reverse and fall.

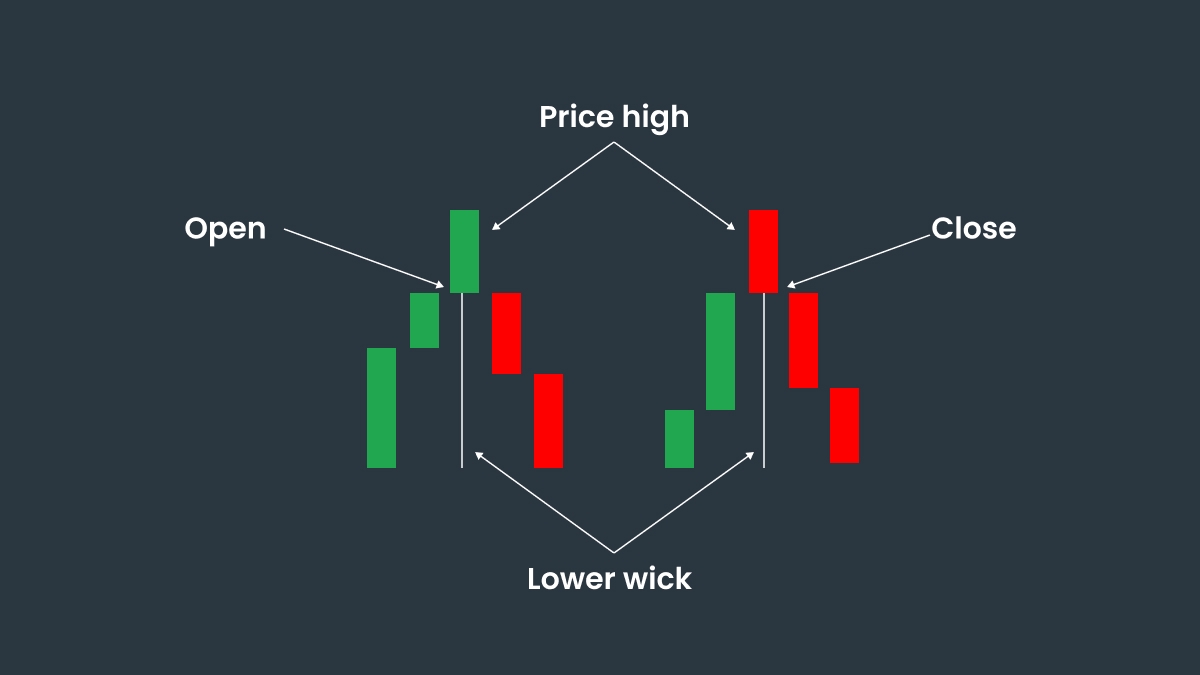
The Hanging Man candle is characterized by a small body and a long shadow (a wick). The long shadow means that during the session the price fell significantly, and the small body indicates that it recovered to the same level as before the opening of the session.

This pattern gets its name from the visual resemblance to a figure with long legs. The Hanging Man candle is not so alarming at first glance because the price has not fallen sharply. But the long shadow is a key indicator that sellers were dominating during the session and that the current trend was weak. A bearish candle after the Hanging Man will confirm that hypothesis. The pattern is especially significant after a long rally or near resistance levels.

To identify the Hanging Man, look for these three signs:

1. A candlestick with a short body and a long wick.

2. The candlestick is at the peak of an uptrend.

3. A bearish candlestick after the Hanging Man.

Red vs green Hanging Man

There are two types of Hanging Man candlestick: red and green. A red Hanging Man means that the price closed below where it opened and sellers are dominating. A green Hanging Man means that the price is higher than the opening one and buyers have taken control by the end.

A red one is considered a warning, like a yellow traffic light. The green one, however, requires more observation and increased attention.

Red vs green Hanging Man

The difference between a Hanging Man and a Hammer candlestick

The difference between a Hanging Man and a Hammer candlestick

A pattern that is often mistaken for a Hanging Man is the Hammer. The decisive factor in distinguishing them is the place of appearance.

• The Hanging Man appears at the peak of the chart after prices have risen and signals a possible market decline.

• The Hammer appears after prices have fallen and foretells the end of a bearish market. The Hammer occurs if sellers have lowered prices and buyers have intervened and raised them up. That trend means the market will start to grow.

To avoid mistaking a Hammer for a Hanging Man, pay attention to the trend leading up to the candlestick.

PatternAppears afterWick directionPossible signal
Hanging ManUptrendLower wickBearish reversal
HammerDowntrendUpper wickBullish reversal

Inverted Hanging Man candles

Some people distinguish a pattern where the wick is located above the body of the candlestick. They call it an Inverted Hanging Man. However, this definition is not generally accepted in technical analysis. Some people confuse this pattern with a Shooting Star, which is formed after an uptrend, and has a long upper shadow and a small body at the base, while the lower shadow is either absent or small. Never call this pattern an Inverted Hanging Man.

Occurrence in uptrends and downtrends

How do you know when to pay attention to the Hanging Man and when to ignore this signal? You should remember that the Hanging Man is a reversal signal after an uptrend. Though candlestick patterns depend on many factors, like market conditions, timeframe, and other technical indicators, analysts consider the Hanging Man pattern to be a fairly reliable tool for determining market reversals, especially when combined with other indicators.

Here’s when you should pay attention to the Hanging Man pattern.

1. The Hanging Man forms after 3-5 green candles.

2. The Hanging Man appears after the price reaches the resistance level on the chart.

3. In the presence of other confirmations, for example, RSI showing overbought.

In an unstable market, the Hanging Man is unreliable.

How to trade the hanging man candlestick pattern

Here’s how to trade using the Hanging Man candlestick. Do not rely on it alone. The pattern must be used in conjunction with other indicators, such as RSI, for additional confirmation.

  1. Finding the trend and pattern. Find a candlestick with a small body and a long shadow. This is only relevant in an uptrend market.

  2. Entry. Wait for confirmation when the next candlestick closes below the low of the Hanging Man. If this happens, open a sell position just below the next bearish candle.

  3. Stop-loss. Set a stop-loss just above the high of the Hanging Man. If the body of the Hanging Man pattern is small, you can set the stop-loss based on the risk/reward ratio of the last resistance level.

  4. Target. There is no single method for setting a target profit for the Hanging Man pattern. You can use the risk/reward ratio, the next resistance level, or the previous low for the take-profit.

Risk and limitations of the pattern

Candlestick patterns have their drawbacks and the Hanging Man is no exception. Be mindful of these when using this pattern.

1. False and ambiguous signals. This pattern can appear even when the market continues to grow, especially if the uptrend is very strong. Green candles can give especially ambiguous signals.

2. Limited information. The Hanging Man is a one-sided pattern that gives traders limited information, so you must use additional tools to confirm the trend.

3. Low reliability on small volumes. The pattern does not work on small market volumes.

4. The pattern does not work in volatile markets. In volatile markets, the Hanging Man pattern is useless and signals nothing.

Real-world examples and chart illustrations

Here’s an example of a Hanging Man candlestick being used on the AUD/USD currency pair.

1. Entry conditions. The candlestick formed on an uptrend, ideally at a resistance level or close to the overbought zone; for example, at a resistance level around 0.65877. It was followed by a bearish candle, confirming that the sellers are in control.

2. RSI above 70. The RSI level above 70 indicates an overbought market and confirms the likelihood of a reversal.

3. Stop-loss. You open a short position and set a stop-loss just above the high of the Hanging Man candle; for example, at 0.66000. This will provide protection in case the market does not reverse.

4. Take-profit. The nearest support level is around 0.65531. The take-profit order is placed there.

Real-world examples and chart illustrations

Never use this pattern in isolation from other tools.

Share with friends:

Open an FBS account

By registering, you accept FBS Customer Agreement conditions and FBS Privacy Policy and assume all risks inherent with trading operations on the world financial markets.

FBS at social media

iconhover iconiconhover iconiconhover iconiconhover icon

Contact us

iconhover iconiconhover iconiconhover iconiconhover icon
store iconstore icon
Get on the
Google Play
store iconstore icon
Get MT4 on the
App Store
store iconstore icon
Get MT5 on the
App Store

Trading

Company

About FBS

Our social impact

Legal documents

Company news

FC Leicester City

Help Center

Partnership programs

The website is operated by FBS Markets Inc.; Registration No. 000001317; FBS Markets Inc. is registered by the Financial Services Commission under the Securities Industry Act 2021, license number 000102/31. Office Address: The Bentley, #16 Cor A Street & Princess Margaret Drive, Belize City, Belize.

FBS Markets Inc. does not offer financial services to residents of certain jurisdictions, including, but not limited to: the USA, the EU, the UK, Israel, the Islamic Republic of Iran, Myanmar.

Payment transactions are managed by HDC Technologies Ltd.; Registration No. HE 370778; Legal address: Arch. Makariou III & Vyronos, P. Lordos Center, Block B, Office 203, Limassol, Cyprus. Additional address: Office 267, Irene Court, Corner Rigenas and 28th October street, Agia Triada, 3035, Limassol, Cyprus.

Contact number: +357 22 010970; additional number: +501 611 0594.

For cooperation, please contact us via [email protected].

Risk Warning: Before you start trading, you should completely understand the risks involved with the currency market and trading on margin, and you should be aware of your level of experience.

Any copying, reproduction, republication, as well as on the Internet resources of any materials from this website is possible only upon written permission.

The information on this website does not constitute investment advice, a recommendation, or a solicitation to engage in any investment activity.