FBS turns 16

Unlock birthday rewards: from gadgets and dreams cars to VIP trips.Learn more
Open account
Open accountLog In
Open account

June 25, 2025

Basics

Understanding Bullish Engulfing Patterns: Examples and Implications

Understanding Bullish Engulfing Patterns: Examples and Implications

What is a bullish engulfing pattern?

MDP-3296_1200x675_2.png

Candlestick patterns are widely used in technical analysis. This popular candlestick pattern signals a potential reversal of a downtrend. The pattern consists of two candlesticks: a bearish candle followed by a larger bullish candle that completely engulfs (envelops) the previous candle's body.

What does this pattern mean?

When you see this pattern, consider it a strong signal of a potential trend reversal from bearish to bullish. Since this is a strong signal, the bullish engulfing pattern is an essential tool for identifying entry points for buy positions.

Traders should keep in mind that this pattern shows a shift in market sentiment. How does it work? The bearish candle reflects selling pressure and a downtrend. The subsequent bullish candle shows strong buying interest and a potential reversal. When this pattern is formed, you should consider it a sign that buyers have overwhelmed sellers and the price will likely start to grow soon.

It is a good idea to confirm this pattern with other technical indicators before you act and open your position. You may want to use increasing trading volume or additional candlestick patterns. If you see multiple indicators confirming the same price forecast, you may open your positions more confidently.

How do you interpret and use the pattern?

If you understand this pattern and its meaning, you can make informed decisions and predict market movements effectively. This pattern helps you understand market sentiment, improving your trading strategies.

Keep in mind that a bullish engulfing pattern is considered a strong buy signal. This makes it a tool for locating entry points for long positions and capitalizing on price movements.

If you analyze the chart and confirm this buy signal with increasing trading volume or additional candlestick patterns, consider the signal valid and buy.

Example

You look at a price chart of a stock and notice two consecutive candlesticks:

Day 1. You see a small bearish candle that indicates a slight price drop: the opening price is higher than the closing price.

Day 2. The second candlestick is a bullish candle. Its opening price is lower than the closing price. It is also larger, completely covering (engulfing) the body of the previous day’s candle.

When you see these two candles, you can conclude that you’ve found a bullish engulfing pattern. This pattern indicates an increased buying pressure and possible upward price movement. When you notice this pattern, you may expect a potential reversal from a bearish trend to a bullish trend.

You can interpret this pattern as a signal that the stock will keep growing. Again, confirm your forecast with volume analysis or other technical indicators. If you consider the forecast strong enough, you may open your own long (buy) position.

Bullish vs. bearish: comparing two engulfing patterns

Bearish Engulfing Pattern

Bullish engulfing patternBearish engulfing pattern

Definition

Two candles:

  1. a smaller bearish candle

  2. a larger bullish candle that completely engulfs the previous candle’s body

This pattern shows that the trend can switch from bearish to bullish.

Two candles:

  1. a smaller bullish candle

  2. a larger bearish candle that engulfs the previous candle’s body

This pattern shows that the trend can switch from bullish to bearish sentiment.

Interpretation

This pattern is considered a bullish reversal signal. It indicates growing buying interest and potential uptrend continuation.This pattern is considered a bearish reversal signal. It indicates heightened selling pressure and potential downtrend continuation.

Market sentiment

We can see that buyers overpower sellers. It means that the pattern reflects a shift in sentiment from bearish to bullish.Sellers dominate over buyers. The pattern indicates a change in sentiment from bullish to bearish.

Trading strategy

You can use this pattern as a buy signal. You can enter long positions and capitalize on potential price growth.You can consider this pattern as a sell signal. You can enter short positions and profit from potential price decline.

Confirmation

You may want to confirm this pattern using increasing trading volume or other technical indicators.Use additional bearish signals or technical analysis tools to confirm the signal is valid.

Bullish engulfing candle reversals

A bullish engulfing candle reversal shows that a downtrend can be replaced with an uptrend. This pattern indicates increased buying pressure that can make the price move upward. Traders often interpret this pattern as a signal to enter buy (long) positions. If you want to validate this buy signal, use volume analysis or other technical indicators.

If you notice the bullish engulfing pattern, you can open a position to profit from upward price movements. Combine this pattern with other technical analysis tools to make your trading decisions more accurate.

How to act on a bullish engulfing pattern

Example of a trade

1. Identify the pattern.

2. Confirm the signal with volume analysis.

3. Consider the current context in the market.

4. Enter your long position (buy the asset).

5. Set your stop-loss order.

6. Use additional indicators for confirmation.

7. Monitor price movement.

IMPORTANT! Remember to combine this pattern with other technical analysis tools. This cautious approach can make your trading decisions much more accurate.

Things to consider when using engulfing patterns

False bullish engulfing signal

False signals

Engulfing patterns can sometimes produce false signals. After all, technical analysis does not guarantee results — it only produces signals that you should further confirm. False signals can cause incorrect trading decisions, especially if you don’t confirm them with other technical indicators or market context.

Subjectivity

Traders may have varying criteria for identifying and validating the engulfing patterns, which means that pattern interpretation can be subjective. This subjectivity means that the signals are not always as universal as we would like them to be.

Lack of context

Engulfing patterns should be considered within the broader market context, as isolated patterns may not always lead to significant price reversals. If you only see an engulfing candlestick pattern, you should not always expect an impressive price movement if no news or decisions may impact the asset in the near future.

Overlapping candles

Engulfing patterns may occur due to overlapping candles or noise in the price chart in some cases. This makes it a real challenge to distinguish valid signals.

Market volatility

When the market is very volatile, false signals are more likely. Volatility reduces the reliability of engulfing patterns as a standalone trading strategy. It means that you should double-check the signals with other indicators or market context.

Risk management

Engulfing patterns alone may not provide sufficient information for effective risk management. You should always use additional tools for extra protection. For example, stop-loss orders and position sizing should always be used when you open your positions.

Timeframe dependence

Engulfing patterns may be more effective for some timeframes and less effective for others. Use the timeframe that best suits your trading style and analyze the chart accordingly.

Confirmation bias

Confirmation bias happens when you search for information that confirms your existing beliefs or decisions. When some info contradicts your opinion, you ignore it. If you rely on engulfing patterns without considering other tools or fundamental factors, you may easily find yourself in a confirmation bias.

Historical performance

If engulfing patterns worked well for you in the past, it does not guarantee future success. The reason is simple: market conditions and dynamics can change over time. Markets exist in the real world, and the real world may change rapidly. You should always consider current market conditions and the situation before you make your trading decision.

Limited predictive power

Engulfing patterns are one of many candlestick patterns. They should be used together with other technical indicators to increase prediction accuracy.

FAQ

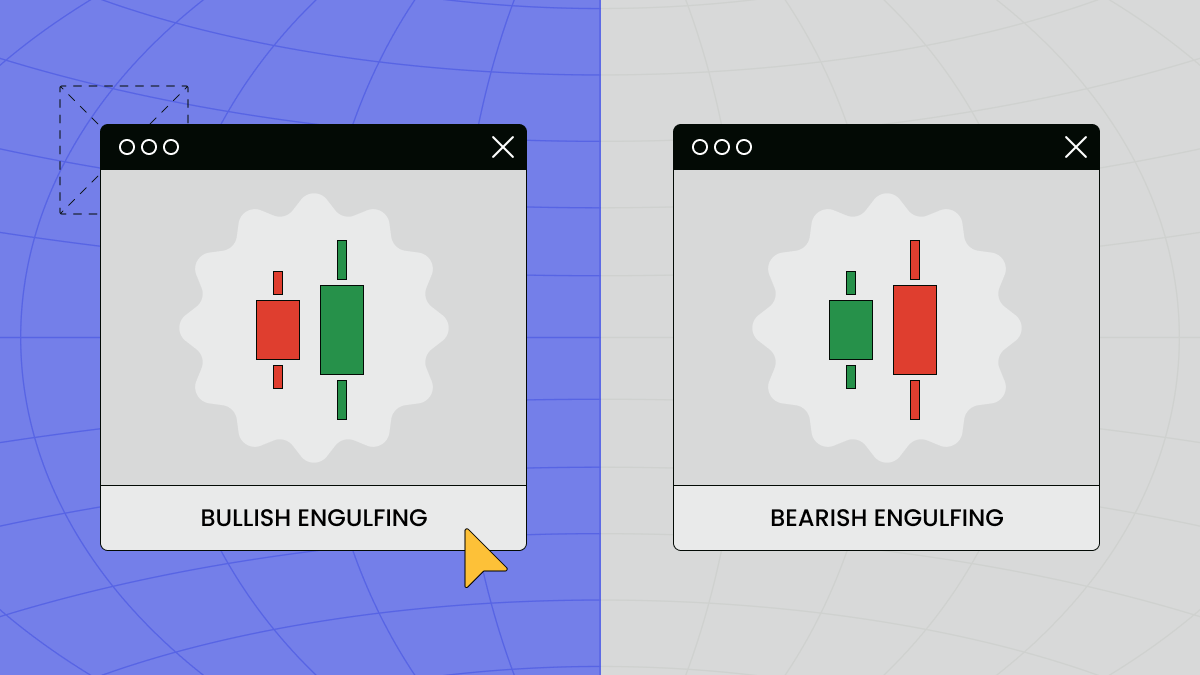
What is a big bearish engulfing pattern?

It is a pattern where a large bullish candle is followed by a larger bearish candle. The second candle fully covers the high and low of the previous candle. This pattern indicates a potential reversal from bullish to bearish momentum.

How strong is a bullish engulfing signal?

Bullish engulfing patterns show a bullish reversal is highly likely, especially when they happen at important support levels or after a prolonged downtrend. However, traders should always consider other technical indicators for confirmation.

Is bullish engulfing a buy or sell signal?

As the name suggests, it is a bullish pattern. This pattern represents a buy signal that indicates the potential for a bullish reversal. You may view it as a situation where buyers have overwhelmed sellers, so you face an opportunity to enter a long position.

Share with friends:

Open an FBS account

By registering, you accept FBS Customer Agreement conditions and FBS Privacy Policy and assume all risks inherent with trading operations on the world financial markets.

FBS at social media

iconhover iconiconhover iconiconhover iconiconhover icon

Contact us

iconhover iconiconhover iconiconhover iconiconhover icon
store iconstore icon
Get on the
Google Play

Trading

Company

About FBS

Legal documents

Company news

FC Leicester City

Help Center

Partnership programs

The website is operated by FBS Markets Inc.; Registration No. 000001317; FBS Markets Inc. is registered by the Financial Services Commission under the Securities Industry Act 2021, license number 000102/31. Office Address: 9725, Fabers Road Extension, Unit 1, Belize City, Belize.

FBS Markets Inc. does not offer financial services to residents of certain jurisdictions, including, but not limited to: the USA, the EU, the UK, Israel, the Islamic Republic of Iran, Myanmar.

Payment transactions are managed by HDC Technologies Ltd.; Registration No. HE 370778; Legal address: Arch. Makariou III & Vyronos, P. Lordos Center, Block B, Office 203, Limassol, Cyprus. Additional address: Office 267, Irene Court, Corner Rigenas and 28th October street, Agia Triada, 3035, Limassol, Cyprus.

Contact number: +357 22 010970; additional number: +501 611 0594.

For cooperation, please contact us via [email protected].

Risk Warning: Before you start trading, you should completely understand the risks involved with the currency market and trading on margin, and you should be aware of your level of experience.

Any copying, reproduction, republication, as well as on the Internet resources of any materials from this website is possible only upon written permission.

The information on this website does not constitute investment advice, a recommendation, or a solicitation to engage in any investment activity.