Open account
Open accountLog In
Open account

Aug 01, 2025

Risk management

What Is a Drawdown in Forex?

What Is Drawdown in Forex?

The market doesn’t move in a straight line. As you trade, you will experience gains and losses, and moments when the market rises and falls. The value of your account, too, will rise and fall according to market prices and your trading strategies. When you’re trading in Forex, it’s therefore not just about how much money you can make: it’s also about how much money you can lose. That’s where drawdown comes in.

What is a drawdown?

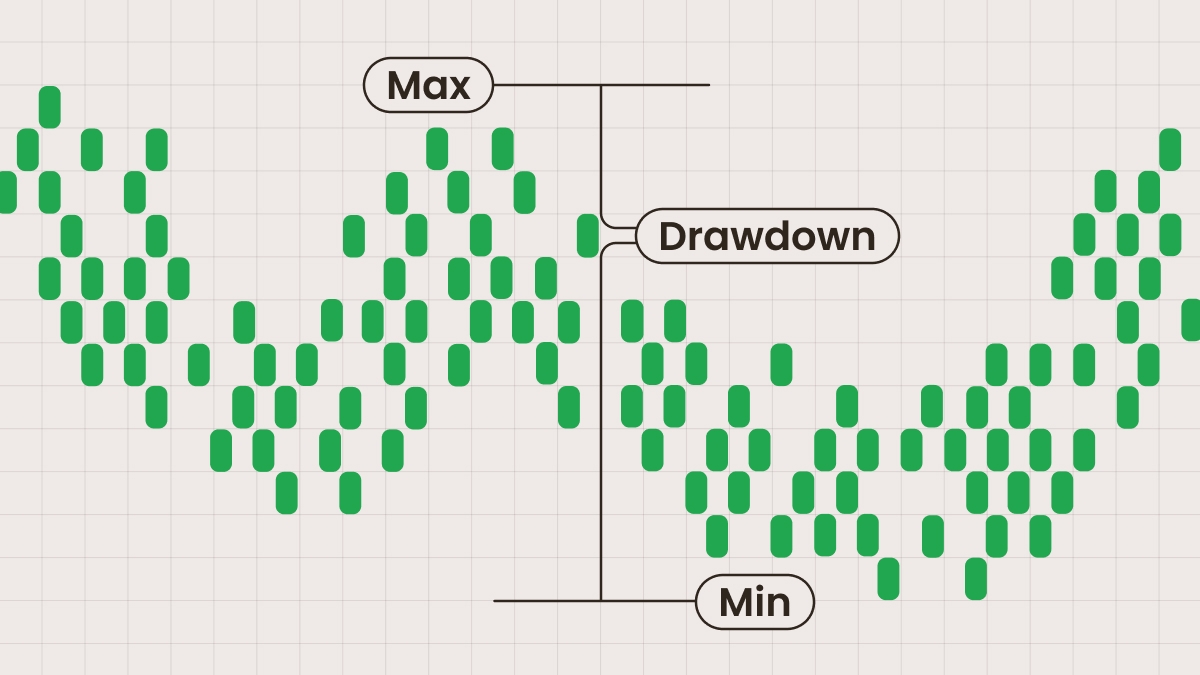
A drawdown is the percentage difference between the highest value of an investment, and the following lowest point before the value recovers. Drawdowns are used in Forex trading to assess the performance and risk of different trading strategies

In a drawdown, the time it takes a price to recover from the drop, if it ever does, is just as important as how far it dropped. It isn’t a loss unless the trader sells the investment at a loss.

Drawdowns are normal. Traders hold on to their investment and wait for it to recover and become profitable.

Key concepts of a drawdown

To understand what a drawdown is, it’s important to know a few key concepts.

The peak is the highest value of an asset or a trader’s investment over a specific period. If you’re looking at a chart, this would look like the peak of a mountain.

The trough is the lowest value of an asset or investment following the peak, before bouncing back and reaching a new high.

The percentage of a drawdown is the percentage by which the asset or investment has dropped from its peak to its trough.

The recovery is the period of time following the trough, during which the asset or investment recovers and returns to its previous peak.

The expansion is the new rise that follows the recovery, when the asset or investment continues to move past the old peak towards a new one.

Drawdown can be floating or fixed. Floating drawdown refers to unrealized losses from positions that are still open and haven’t been closed yet. If a trader holds on to these positions, they have the possibility of moving back up into positive territory. Fixed drawdown refers to realized losses from positions that have been closed. This money is lost forever because the assets have been sold at a loss.

Types of drawdown

Maximum drawdown refers to the biggest drop an account has ever experienced before bouncing back and recovering. It shows the worst that can happen. The bigger the drop is, the riskier the investment is, and the more money you can potentially lose. If you’re using leverage or trading for the long term, maximum drawdown can tell you how much pain you’d need to sit through before recovering.

Average drawdown is the average of all the dips over time and gives investors a sense of how often their account dips and how low those dips usually go. If in the last six months, a trader’s account experienced a few small drawdowns of 10%, 12%, 8%, and 14%, the average drawdown would be around 11%.

The Calmar Ratio is not a drawdown, but it uses a drawdown to check how much return you are getting per year in exchange for the amount of risk you take. It compares how much profit you made in a year to the biggest drop, or maximum drawdown, your investment experienced. For example, if your investment made 15% in one year, but at one point during the year dropped 5%, the Calmar Ratio would be 3 (15 divided by 5). A higher Calmar Ratio means you're making more money with less risk. Using this is a quick way to see how efficient your strategy is in terms of making money,and in terms of risk.

Example of a drawdown in Forex

Suppose a trader buys the EURUSD pair at 1.1000. The price then rises to 1.2000 before dropping to 1.0000. After hitting 1.0000, it climbs back up to 1.2000 again. The price never goes below 1.0000 during that period, so in this case, the peak was 1.2000 and the trough was 1.0000.

The drawdown is the drop from the peak, or highest point, to the trough, or lowest point. The drawdown from 1.2000 to 1.000 is 16.67%.

Even though the stock had a 16.67% drawdown, however, the trader didn’t actually lose 16.67%. They bought at 1.1000, so their unrealized loss at the bottom of 1.0000 was just 100 pips, not 200.

Drawdown is how far the price dropped from its highest point, not how much the trader personally lost. How much they lost depends on when they entered the trade.

Afterwards, if the price climbs to a new peak of 1.3000, drops to 1.2000, and then bounces back up to 1.3000 again, you have a drawdown of 7.69%. Each time the stock hits a new high and then dips, that’s a new drawdown.

Risks of drawdowns

One of the tricky things about drawdowns is that the bigger the drop, the harder it is to get back to where you were. For example, if your Forex account drops by 5%, you only need about a 5.26% gain to break even. But if it falls by 40%, you need a 67% gain just to get back to the starting point. The bigger the fall, the steeper the climb.

That’s why a lot of traders get worried when they see a big drop. Imagine someone’s account goes from $6000 down to $3600. That’s a 40% loss. It’s easy to feel stressed and want to pull out to avoid losing more money.

But if you don’t need the money right away, it might be better to wait. During the pandemic in 2020, the market dropped hard on some days, sometimes over 7%. Many people sold out of fear. But those who stayed in saw their accounts bounce back big time. Over the next year or two, some even grew by 50% or more.

Drawdowns can be tough and mess with your head. But if your strategy makes sense and you don’t have to sell, hanging in there and riding the wave usually pays off in the long run. Remember, it’s only a real loss if you sell when things are down.

Why are drawdowns important?

Drawdowns are a normal part of investing and will happen even with the most successful strategies. Keeping this in mind can help traders keep a cool head and manage their emotions when encountering losses or when the market peaks and reverses. If you look at the history of the S&P 500, you’ll see that it experienced many drawdowns. Long-term, however, it always ended up recovering and expanding.

Drawdowns can also be used to measure risk and performance related to portfolios and trading strategies. You can decide whether the amount of risk you’re taking is worth the gains you’re making, leading to better management of your money. You can compare different strategies and their respective drawdowns to find the one that works best for you.

Knowing the average drawdown of a particular strategy can help traders identify levels at which to set their stop-loss orders to limit potential losses. Just because a stop-loss gets triggered doesn’t mean the strategy doesn’t work. You just want the strategy to be profitable more times than it is unprofitable.

Share with friends:

Open an FBS account

By registering, you accept FBS Customer Agreement conditions and FBS Privacy Policy and assume all risks inherent with trading operations on the world financial markets.

FBS at social media

iconhover iconiconhover iconiconhover iconiconhover icon

Contact us

iconhover iconiconhover iconiconhover iconiconhover icon
store iconstore icon
Get on the
Google Play
store iconstore icon
Get MT4 on the
App Store
store iconstore icon
Get MT5 on the
App Store

Trading

Company

About FBS

Our social impact

Legal documents

Company news

FC Leicester City

Help Center

Partnership programs

The website is operated by FBS Markets Inc.; Registration No. 000001317; FBS Markets Inc. is registered by the Financial Services Commission under the Securities Industry Act 2021, license number 000102/31. Office Address: The Bentley, #16 Cor A Street & Princess Margaret Drive, Belize City, Belize.

FBS Markets Inc. does not offer financial services to residents of certain jurisdictions, including, but not limited to: the USA, the EU, the UK, Israel, the Islamic Republic of Iran, Myanmar.

Payment transactions are managed by HDC Technologies Ltd.; Registration No. HE 370778; Legal address: Arch. Makariou III & Vyronos, P. Lordos Center, Block B, Office 203, Limassol, Cyprus. Additional address: Office 267, Irene Court, Corner Rigenas and 28th October street, Agia Triada, 3035, Limassol, Cyprus.

Contact number: +357 22 010970; additional number: +501 611 0594.

For cooperation, please contact us via [email protected].

Risk Warning: Before you start trading, you should completely understand the risks involved with the currency market and trading on margin, and you should be aware of your level of experience.

Any copying, reproduction, republication, as well as on the Internet resources of any materials from this website is possible only upon written permission.

The information on this website does not constitute investment advice, a recommendation, or a solicitation to engage in any investment activity.