FBS turns 16

Unlock birthday rewards: from gadgets and dreams cars to VIP trips.Learn more
Open account
Open accountLog In
Open account

July 09, 2025

Basics

What Is Open Interest and How Does It Work in Trading?

What Is Open Interest and How Does It Work in Trading?

Wonder what open interest is and what role it plays in data-saturated markets? In this article we will break down how it works, why it matters, and how to use it to your advantage.

What is open interest?

Understanding open interest is crucial for traders who want to gain experience in futures or options markets.

Open interest (OI) is the total number of outstanding derivative contracts (futures or options) that are still active and not yet closed or expired at the end of trading. Open interest is not a price indicator nor a daily volume measure; rather, it is an open commitment gauge in a market.

You can use open interest (along with volume and price) to measure liquidity, confirm trends, and predict turning points in the market.

How open interest works

Each contract has a buyer and a seller, and open interest counts one contract per pair. It rises when a buyer and a seller open a new contract and falls when either party closes or offsets an existing contract.

  • New buyer + new seller = open interest increases.

  • A buyer or a seller closes the trade = open interest decreases.

  • A contract is transferred between parties = there’s no change in open interest, because the contract remains outstanding.

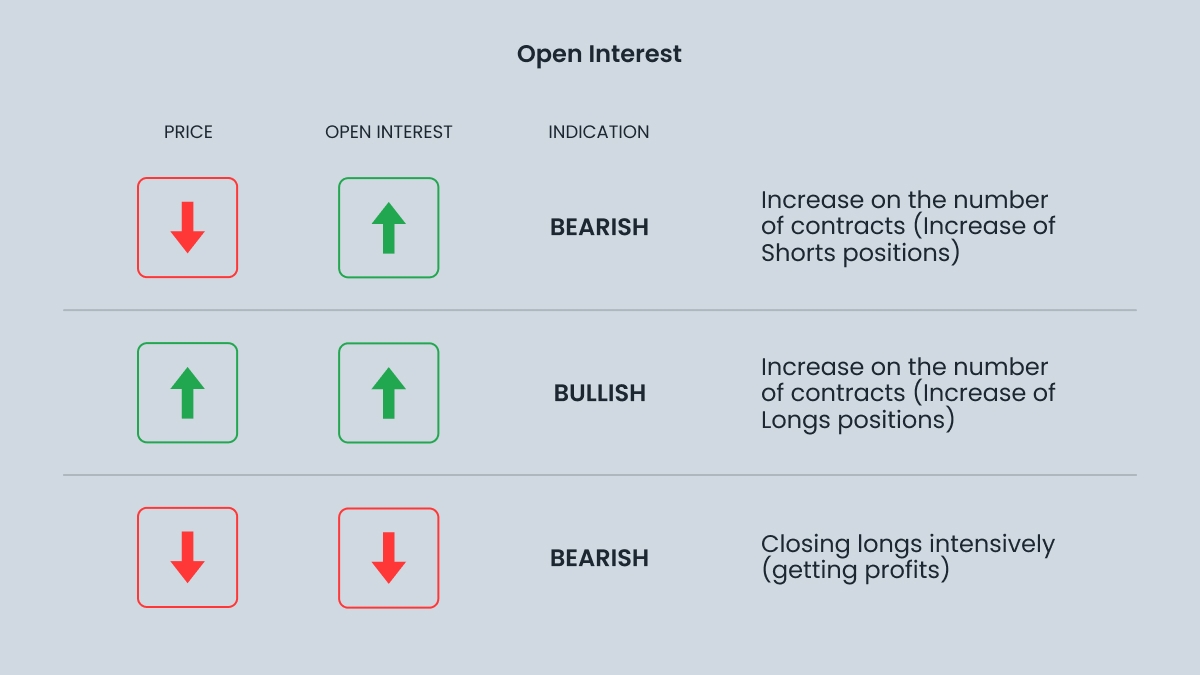
Exchanges report end-of-session OI for each maturity or strike — that’s how traders can monitor the net increase or decrease in outstanding risk. Take a look at the table below to learn how open interest and price movements reflect a trend direction.

How open interest works

Open interest represents contracts that are “still on the books,” so it can be compared to merchandise on a warehouse shelf. Contracts disappear only with delivery or offset, so OI enjoys a persistence that daily volume doesn’t.

Open interest vs volume: what is happening in the market?

While trading volume counts all transactions executed during a day (and one contract may be registered many times as it changes hands), open interest increases or decreases only when new contracts are created or closed, so it tracks the growth or decline of participation rather than activity.

Important: volume reflects daily activity, while open interest indicates existing commitments. Take the example of a crude oil futures market.

  • On day one, 500 new contracts are entered into between new shorts and longs; volume = 500 and OI = 500.

  • On day two, they are traded back and forth 1000 times but not closed; volume = 1000 whereas OI is still 500.

  • On day three, 200 contracts are offset; volume = 200 and OI = 300.

This is how open interest removes intraday churn and highlights whether exposure is increasing or decreasing.

Want to trade confidently? Trade with FBS!

Why open interest matters for traders

Open interest is a valuable tool that can give insight into:

  • Market activity and liquidity. The higher the open interest, the more participants are in the market, and, therefore, the higher the liquidity. Trading in more liquid markets, you can expect tighter bid‑ask spreads, better execution, less slippage, and greater depth in high-interest contracts order books, which lowers trading costs. Low open interest can signal that the market is thin, so it might be prone to erratic moves and manipulation. Options traders examine strike‑specific OI in an effort to estimate where large outstanding positions could push price action into expiring.

  • Trend strength or weakness. Falling open interest may be a sign that the trend is waning, and vice versa: open interest rising means that new positions are being opened to support the move. Knowing this, you can reduce the risk of false breakouts and trade with greater confidence. However, always take price action into account: When OI rises in tandem with a price rise, it’s likely that new capital or short covering is powering the move and the trend can be sustained. When the price goes up and the OI remains unchanged or falls, the uptrend may be due to short covering or thin liquidity — the momentum is weak. On a price fall, rising OI implies forced selling pressure, and falling OI implies liquidation instead of fresh aggressive shorts.

  • Potential reversals. Seeing a sudden drop in open interest? It often signals profit-taking or exhaustion, and a trend may reverse or go sideways. As usual, don’t stick to one tool, combine OI with others like divergence, RSI, and candlestick patterns to spot turning points.

  • Trader sentiment (especially in options). Open interest at certain strike prices and types (calls vs puts) can give you a clue about how traders expect the market to behave. Open interest in puts often rises during market uncertainty, reflecting hedging or bearish sentiment. On the other hand, open interest in calls may rise when traders expect upside.

Your future portfolio starts today! Explore trading with FBS.

How to analyze shifts in open interest

Open interest is a powerful, and often underused tool. While it doesn’t provide clear buy or sell signals on its own, it adds valuable context when combined with price and volume. Understanding shifts in open interest helps you track market sentiment and potential reversals. Here’s how to analyze shifts:

  1. Determine the current price trend.

  2. Ask yourself: is open interest increasing, level, or decreasing?

  3. Make sure that volume confirms what open interest is implying.

For example, an ascending equity‑index future with increasing OI and respectable volume indicates overall eager buying. If the price goes up but the OI flattens out and the volume drops off, the rally might be losing internal sponsorship. On the other hand, a horizontal price trend with steadily increasing OI and volume can signify accumulation that results in a breakout.

Look at a December copper futures contract which rises from $3.50 to $4.20 a pound over six weeks as open interest rises from 120 000 to 180 000 contracts to validate the uptrend. Copper grinds out nominal new highs over the next three sessions, but OI falls to 170 000 and daily volume diminishes. The divergence warns longs are being distributed into strength. A break below near-term support on a later session confirms the warning and signals traders who utilized the OI signal to tighten risk.

Limitations and best practices

Open interest is a useful tool, but you shouldn’t rely on it solely, since it can’t really forecast price action.

  • Open interest is updated only once per day, so the data is unavoidably delayed. Seasonal rollovers also distort headline figures as market participants roll out of an expiring contract into the next month. Look at expiration cycles and continuous datasets to prevent misleading impressions.

  • OI doesn't show direction. Rising open interest can mean more longs or more shorts since each contract represents both sides of the trade. A solution is to combine it with price action, options skew or trader classification data like the CFTC's Commitment of Traders reports for stronger confirmation.

Use open interest to paint a clearer picture and add context. Don’t forget to monitor volume and trendlines. In options, analyze open interest by strike price and expiry to identify key levels.

Explore smart investing with FBS — trade now!

Share with friends:

Open an FBS account

By registering, you accept FBS Customer Agreement conditions and FBS Privacy Policy and assume all risks inherent with trading operations on the world financial markets.

FBS at social media

iconhover iconiconhover iconiconhover iconiconhover icon

Contact us

iconhover iconiconhover iconiconhover iconiconhover icon
store iconstore icon
Get on the
Google Play

Trading

Company

About FBS

Our social impact

Legal documents

Company news

FC Leicester City

Help Center

Partnership programs

The website is operated by FBS Markets Inc.; Registration No. 000001317; FBS Markets Inc. is registered by the Financial Services Commission under the Securities Industry Act 2021, license number 000102/31. Office Address: 9725, Fabers Road Extension, Unit 1, Belize City, Belize.

FBS Markets Inc. does not offer financial services to residents of certain jurisdictions, including, but not limited to: the USA, the EU, the UK, Israel, the Islamic Republic of Iran, Myanmar.

Payment transactions are managed by HDC Technologies Ltd.; Registration No. HE 370778; Legal address: Arch. Makariou III & Vyronos, P. Lordos Center, Block B, Office 203, Limassol, Cyprus. Additional address: Office 267, Irene Court, Corner Rigenas and 28th October street, Agia Triada, 3035, Limassol, Cyprus.

Contact number: +357 22 010970; additional number: +501 611 0594.

For cooperation, please contact us via [email protected].

Risk Warning: Before you start trading, you should completely understand the risks involved with the currency market and trading on margin, and you should be aware of your level of experience.

Any copying, reproduction, republication, as well as on the Internet resources of any materials from this website is possible only upon written permission.

The information on this website does not constitute investment advice, a recommendation, or a solicitation to engage in any investment activity.