.jpg)
What is the force index
The force index (FI) is an indicator developed by Alexander Elder. It measures the force of bears and bulls in a trending market. This indicator is based on price, direction, and trade volumes, which are, according to Elder, the three essential elements of price movement.
The FI can confirm a trend, identify corrections worth trading, and foresee reversals.
Understanding the force index
To understand the force index indicator, it is essential first to understand the relationship between price movement and trading volume. Strong trends typically accompany increased trading volume, while weaker trends have lower trading volumes. The force index measures the strength of a trend by comparing the current period's closing price, the prior period's closing price, and the trading volume over the same period.
How to calculate
The force index is calculated using a simple formula:
Force index = (current close – prior close) x volume
Then an exponential moving average is applied to the resulting value so that you have a histogram and a line in the indicator’s window.
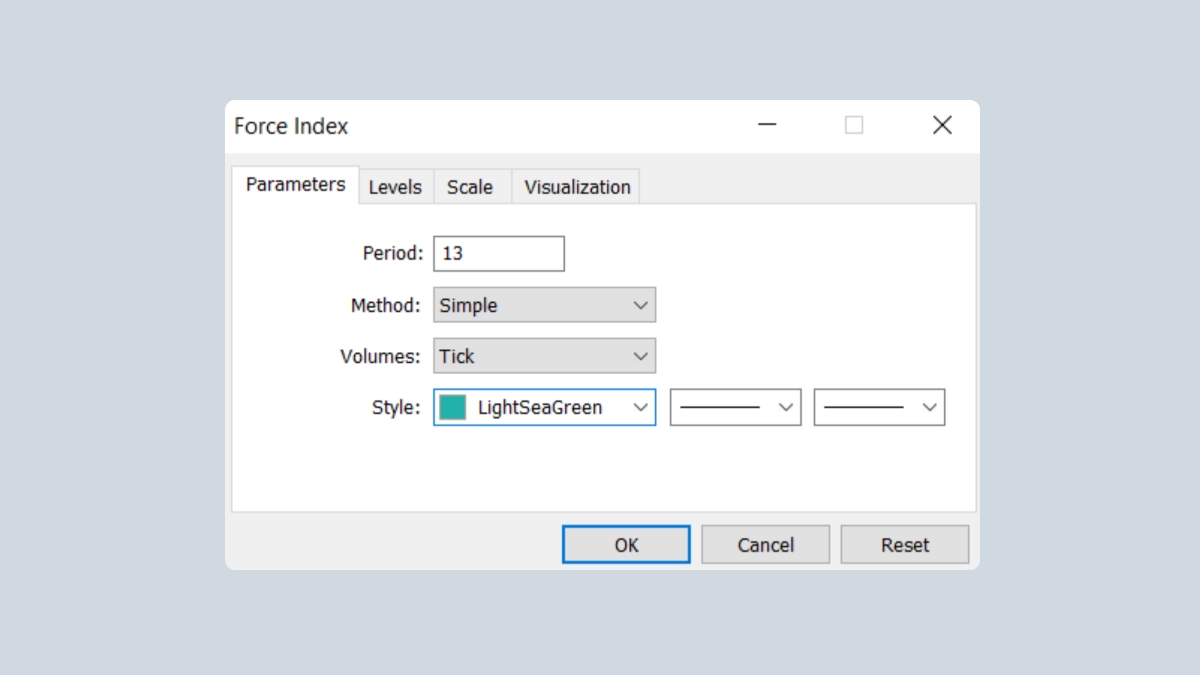
Traders can customize the force index by adjusting the period used for the moving average of the volume data. Longer periods provide more stable indicators, while shorter periods are more sensitive to short-term changes.
How to implement
The force index is a default feature of MetaTrader. You can add it to the chart by clicking Insert – Indicators – Oscillators and then choosing Force Index.
How to interpret
The index will be positive if the current closing price is higher than the previous one. When the indicator rises, it shows the bulls’ force. Vice versa, if the closing price is lower than the previous one, the indicator will be negative, showing the bears' force. It's worth watching the moments when the FI crosses the zero line.
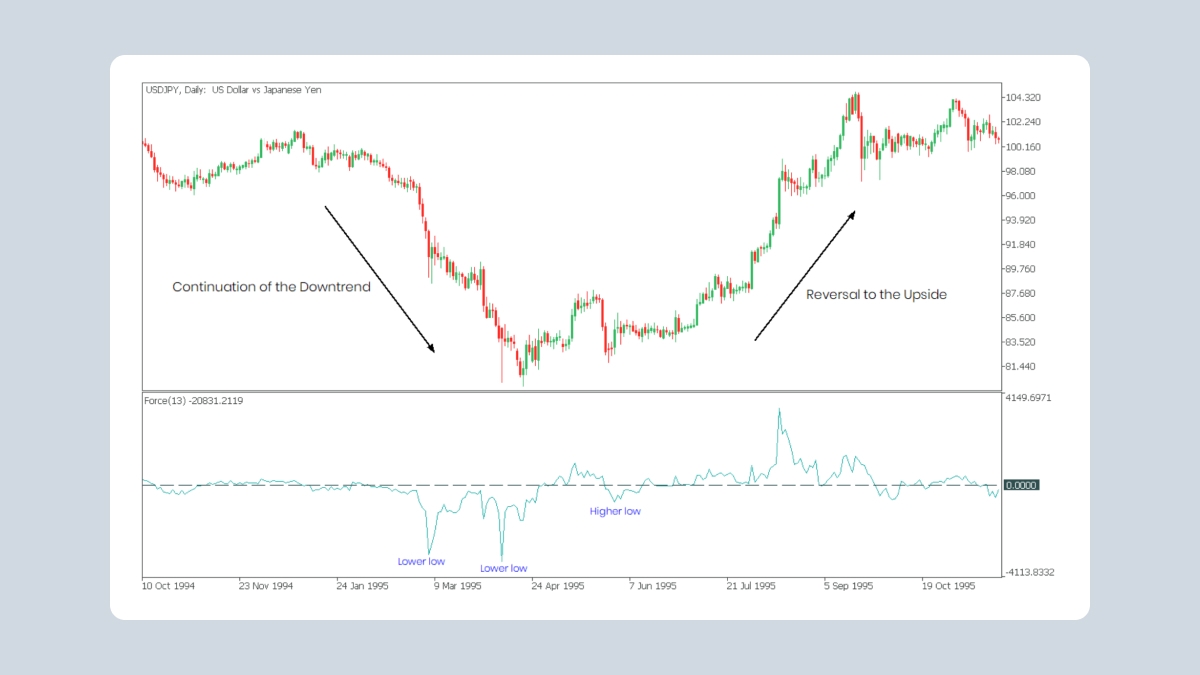
In addition, the indicator also comprises the volume data. This allows a trader to make a better judgment about a trend and its momentum. The current uptrend will likely continue when the force index gets to a new high. When the FI slides to a new low, the downtrend will go on. The trend may reverse up when the FI gets to a higher low.
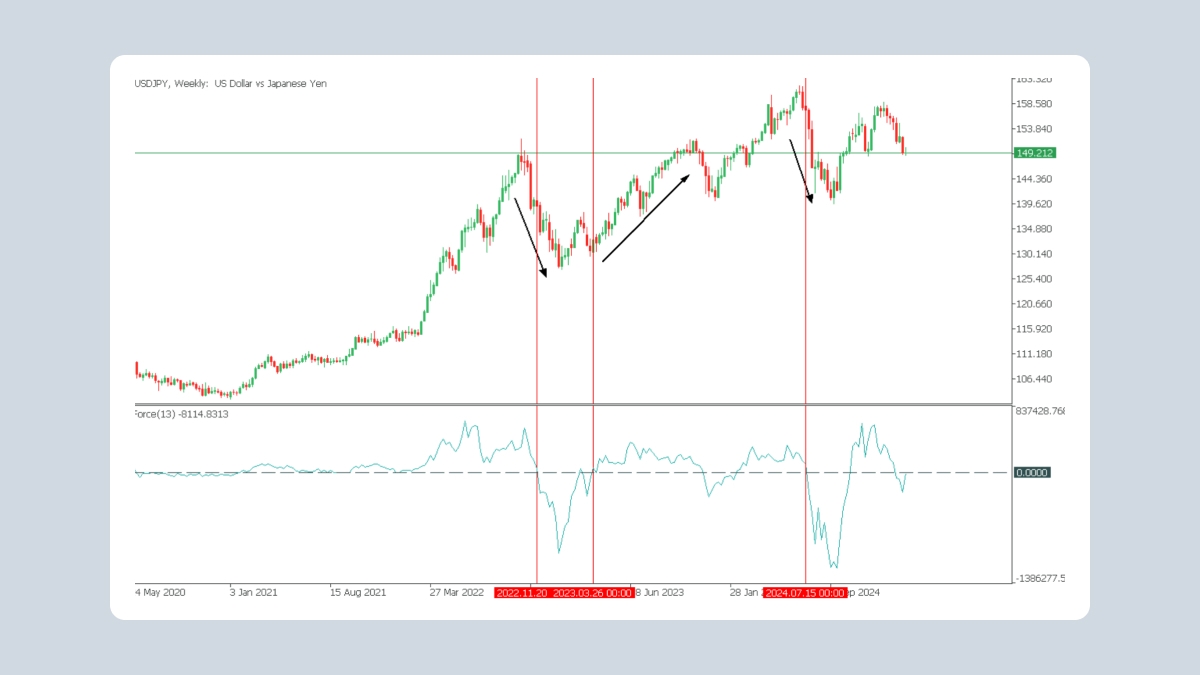
If a trend is strong, the force index will change sharply. More likely, it will signal the continuation of a trend. At the same time, if the price changes by inertia, the FI will move only slightly. The uptrend weakens if the current price increases but the indicator does not.
Below are various signals provided by the force index. Use them wisely and remember that confirmation from other tools is always welcome.
Bullish signals produced by the FI:
Force index is printing new highs in a rising trend (trend continuation).
Force index falls below zero during a rising trend (buy on dips).
Force index rises above zero in a downtrend (buy on correction counter the main trend).
Force index crosses the MA to the upside (if you apply a MA to the indicator).
Divergences (price prints lower lows, but FI makes higher lows).
Bearish signals produced by the FI:
Force index is printing new lows in a downtrend (trend continuation).
Force index rises above zero during a downward trend (sell on pullbacks).
Force index drops below zero in an uptrend (sell on correction counter the main trend).
Force index crosses the MA to the downside (if you apply a MA to the indicator).
Divergences (price prints higher highs when FI makes lower highs).
Force index divergences
Bullish and bearish divergences indicate a potential change in trend direction. These classic signals are often associated with oscillators. A bullish divergence occurs when the indicator moves upward while the security moves downward. This suggests that the price’s weakness is not being confirmed by the indicator, which may signal a forthcoming bullish trend reversal. On the other hand, a bearish divergence occurs when the indicator moves downward while the asset moves upward. This indicates underlying weakness, despite the higher price, which could foreshadow a bearish trend reversal.
Confirmation is a crucial aspect of interpreting bullish and bearish divergences. Although divergences signal something unusual, they require a confirmation from the indicator or price chart. A bullish divergence can be confirmed by the force index moving into positive territory or a resistance breakout on the price chart. A bearish divergence can be confirmed by the force index moving into negative territory or a support break on the price chart. For confirmation, traders may also use technical analysis tools such as candlesticks, moving average crosses, and pattern breaks.
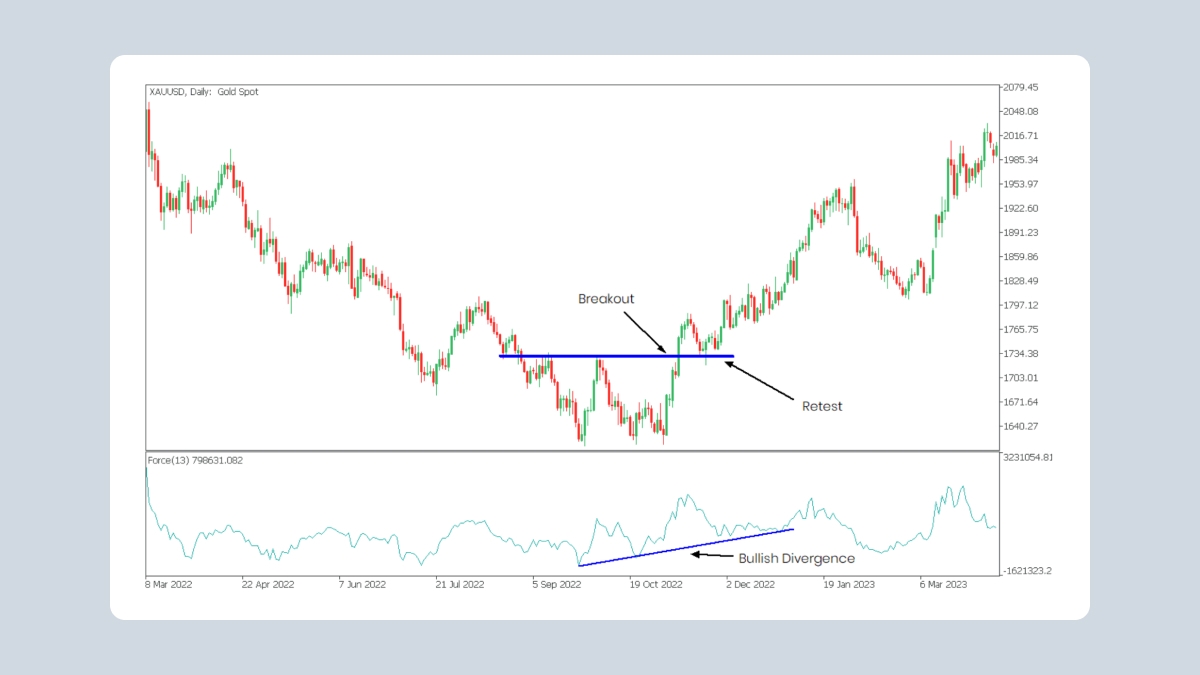
On the chart above, the force index indicator has formed a bullish divergence on the daily timeframe. Every indicator's low is higher than the previous one, while every price low remains at the same level. A trader needs to get a second confirmation of a potential trend reversal to find the best entry point. In this situation, it would be the price breakout above the resistance level and retest of this breakout. Thus, a trader can open a buy trade after the price successfully retests the highlighted level.
Force index vs. money flow index (FI vs. MFI)
The money flow index (MFI) and the force index employ price and volume to gauge trend strength and identify possible price reversals. However, their indicator calculations differ significantly. The MFI employs a more intricate formula incorporating the typical price (high + low + close / 3) instead of solely relying on closing prices. Furthermore, the MFI is limited to a range of zero to 100. As a result of its distinct computation and bounds, the MFI can provide unique insights that differ from the force index.
Force index limitations
The force index is a lagging indicator that uses previous price and volume data to calculate an EMA average. However, since the data is usually averaged, it may be slow to generate trading signals, resulting in missed opportunities. Using a shorter-term force index (e.g. 10, 13, or 20) can lead to numerous false signals due to minor price or volume fluctuations. On the other hand, a longer-term force index (e.g. 50, 100, or 150) is less prone to swings, but it reacts slowly to price changes, leading to delayed trade signals.
The force index indicator in summary
To conclude, the force index is considered one of the best combinations of price and volume. Notice that the FI uses the tick volume data in currency trading, corresponding to the number of transactions, so some distortions are possible. The force index shows the best results when applied to volatile markets.