Fundamental Analysis | Análisis Fundamental
The Nasdaq 100 ended the week down nearly 4 %, pressured by a sharp pullback in AI-related tech stocks.
Companies like Palantir fell more than 7 % despite strong earnings, while Nvidia lost around 3–4 % amid reduced risk appetite across the technology sector.
Key Drivers:
The main trigger came from the revelation that Michael Burry took over $1.1 billion in put options against Nvidia and Palantir, which the market interpreted as a warning of possible overvaluation in AI-linked equities.
Adding to the bearish tone, several U.S. bank CEOs warned that equity valuations remain “high” and that a correction could occur if enthusiasm over AI cools.
This combination sparked broad-based selling in the tech sector — which makes up more than 40 % of the Nasdaq 100 — intensifying intraday volatility and adding downward pressure to the index.
Traders now focus on whether the US100 can hold key support levels or if the correction could deepen toward October lows.
November Seasonality in the Nasdaq 100 | Estacionalidad de noviembre
Historically, November tends to be a bullish month for growth and tech-heavy indices like the Nasdaq 100.
According to Bank of America, the index has posted positive returns roughly 69 % of the time in November, with an average gain of 2.5–2.7 %.
Other historical datasets show November as one of the strongest months of the year for both the S&P 500 and Nasdaq, typically delivering +1 % to +3 % average returns.
This implies that even after the –4.48 % weekly drop, there may be medium-term structural support driven by seasonal recovery patterns following the October weakness.
Technical Analysis | Análisis Técnico
US100 (H4) — Intraday & Swing Perspective
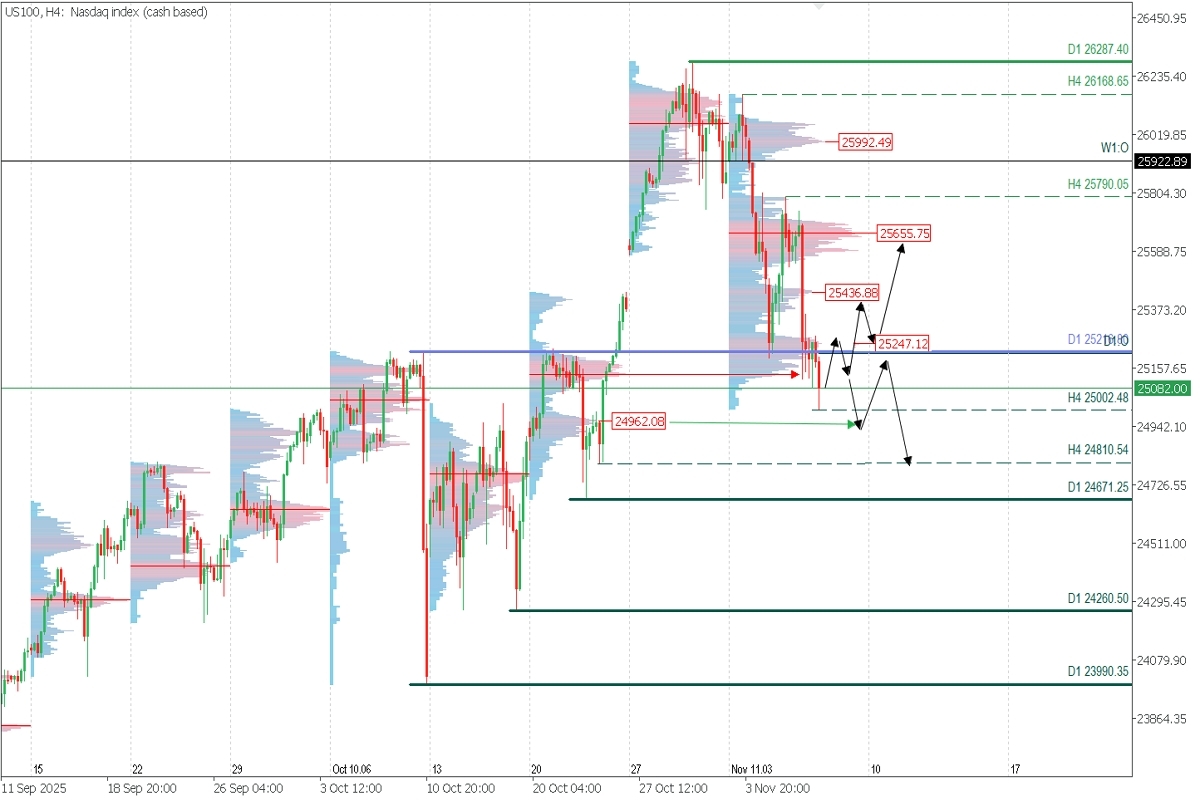
- Supply Zones (Sellers): 25 250 | 25 436.88 | 25 655.75
- Demand Zones (Buyers): 24 962.08
The index shows a weekly decline of 4.46 %, viewed as an intraday correction while holding key H4 support at 24 810.54 and daily support at 24 671.25.
As long as these supports remain intact, the drop is considered corrective rather than structural.
The key intraday resistance sits at 25 790.05, and only a confirmed breakout above that level would signal a potential recovery, which is not expected today.
After reaching a local low near 25 002.48 on Friday’s European morning session (Nov 7), a short-term rebound toward 25 250 is anticipated.
Bearish Continuation Scenario:
If price respects the 25 250 supply zone, a new decline toward the 24 962 demand node could test the H4 support again.
Bullish Scenario:
If price breaks decisively above 25 250, the rally could extend toward the 25 436.88 supply zone — and only a clear breakout above 25 655.75 would confirm an extended bullish phase.
Note on PAR (Exhaustion/Reversal Pattern):
Always wait for a confirmed PAR formation on M5 before entering trades in the key zones mentioned.
👉 Learn how to identify PAR setups here
POC (Point of Control) Explained:
The POC marks the level with the highest trading volume concentration.
- If a bearish move originated from it, the area becomes resistance.
- If it followed a bullish impulse, it turns into support, often marking demand zones at lower levels.
