On Friday, after climbing to its highest level since November 12 above 1.2800, GBPUSD lost momentum later in the day and ended lower, breaking its three-day winning streak. On Monday morning, the pair is holding steady and aiming to retest the 1.2780 resistance level.
Friday's US jobs report showed that 227,000 new jobs were added in November, exceeding the expected number. Let's see how this lines up on the chart.
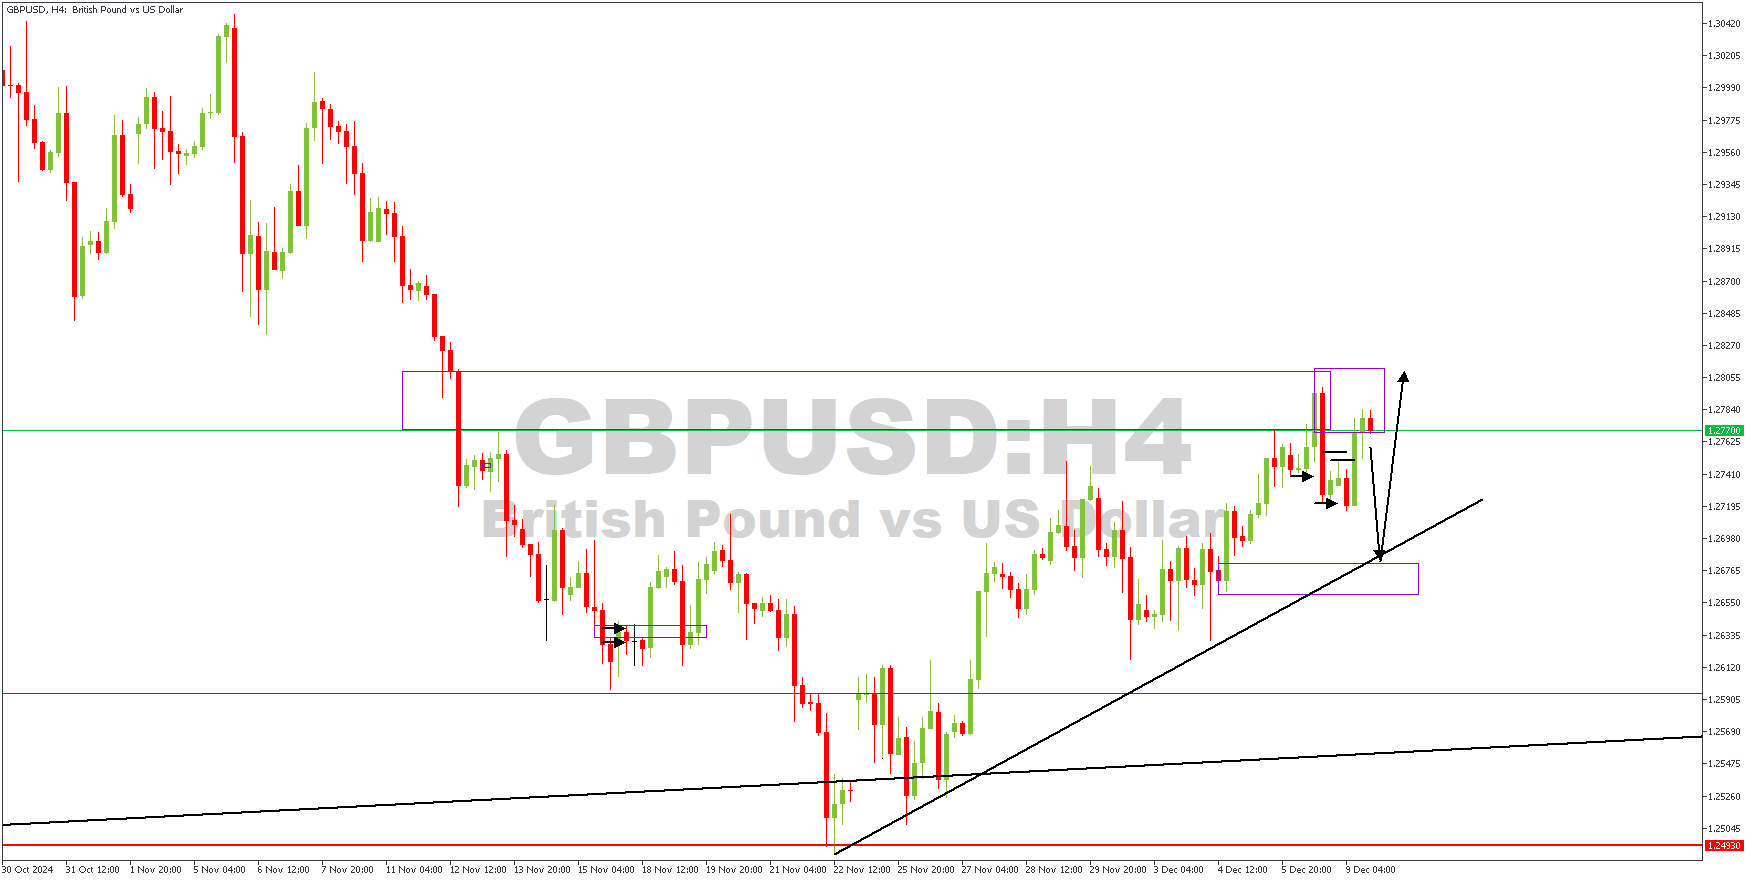
GBPUSD – H4 Timeframe

The marked zone on the 4-hour timeframe of GBPUSD highlights a Fair-Value Gap from which the price initially reacted. Based on the strength of the initial rejection, a critical look at the lower timeframe is necessary to unveil the actual momentum of the bearish move.
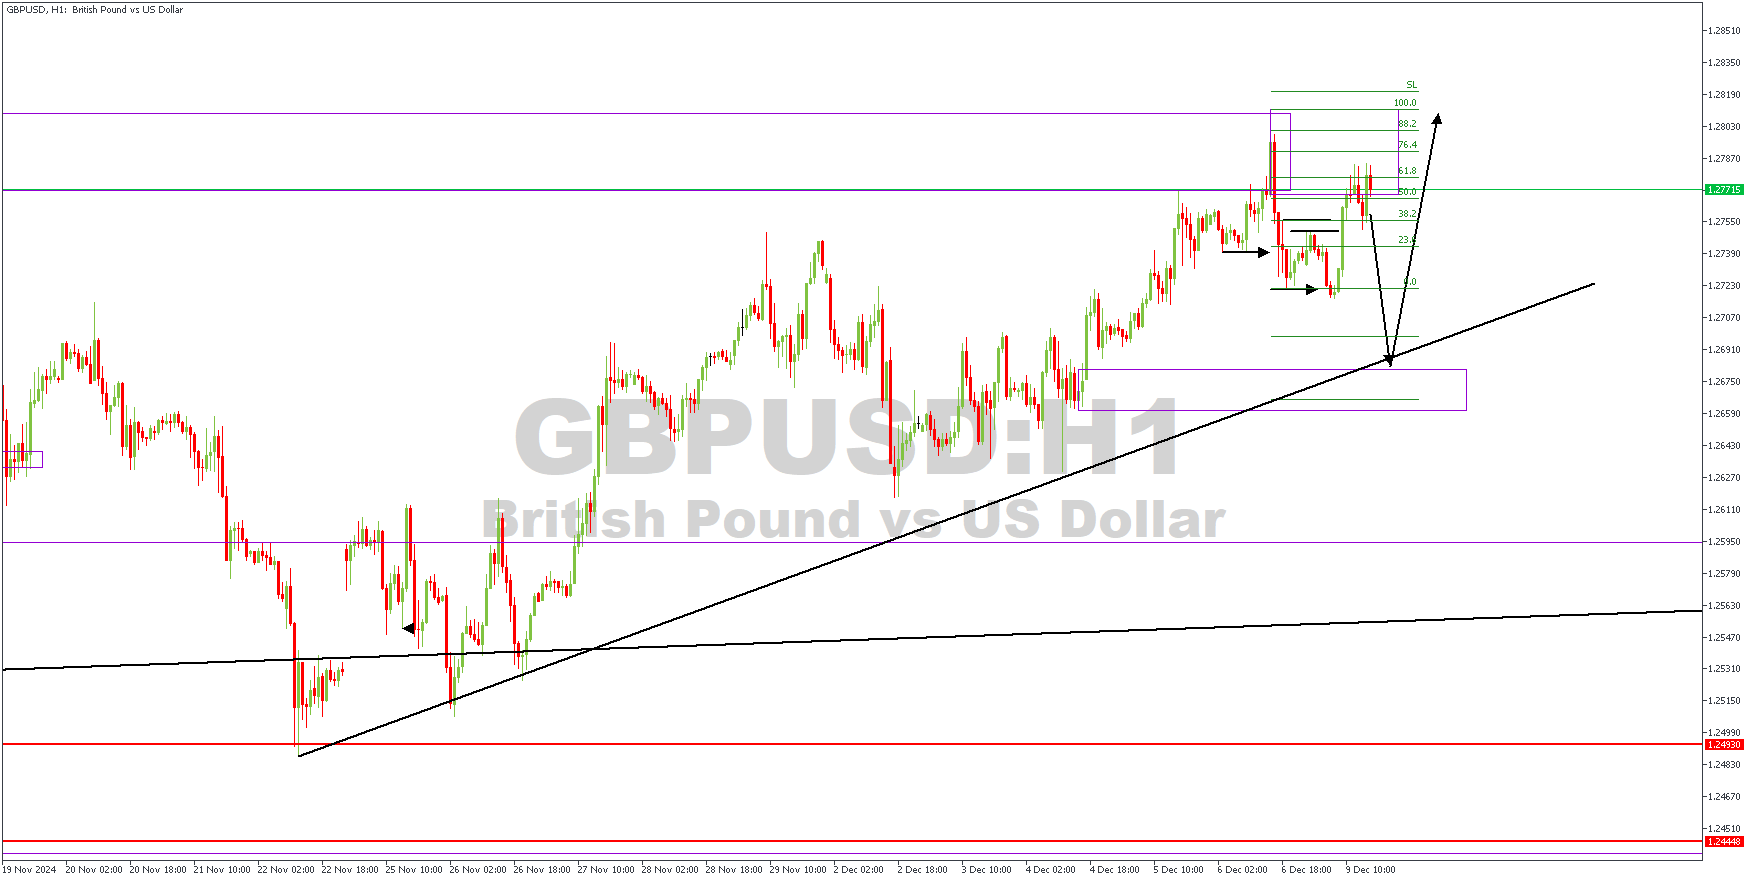
H1 Timeframe

The 1-hour timeframe chart of GBPUSD shows that the initial rejection from the 4-hour timeframe FVG (Fair-Value-Gap) formed a double break-of-structure pattern. The current bullish retracement is heading towards the prime levels of the Fibonacci retracement tool. In this light, the price will move further down towards the confluence of the trendline support and demand zone before returning to a higher bullish momentum.
Analyst's Expectations:
Direction: Bearish
Target: 1.26851
Invalidation: 1.28199
CONCLUSION
You can access more trade ideas and prompt market updates on the telegram channel.


