Release Date: Friday, 8:30 AM ET (1:30 PM WAT)
Market Impact: High – U.S. dollar crosses, Treasury yields, and Fed rate expectations are all in play.
Why It Matters
The May U.S. Personal Consumption Expenditures (PCE) report will test the Fed’s patience and potentially rattle dollar markets as traders reassess the path of rate cuts heading into Q3.
- Headline PCE (YoY): Expected to rise to 2.3% (prior: 2.1%)
- Core PCE (YoY): Forecast at 2.6% (prior: 2.5%)
- Monthly Core PCE: Seen holding at 0.1%
According to the Financial Times, These estimates suggest inflation remains sticky, possibly reinforced by early signs of tariff-related price pressures.
Fed Implications
The Fed’s own 2025 inflation forecast of 3.0% and a data-dependent stance leave it walking a tightrope. While two rate cuts are still priced in for 2025, a hotter-than-expected print could:
- Delay the first cut
- Lift U.S. yields
- Strengthen the dollar
Conversely, a soft or in-line print could revive dovish bets—especially if paired with slowing wage growth or weaker consumer spending.
Currency Market Watch
Expect sharp FX volatility, especially in dollar pairs:
- Bullish USD Scenario: Stronger PCE → DXY up, EURUSD, AUDUSD, and GBPUSD down
- Bearish USD Scenario: Weaker PCE → DXY dips, risk currencies rally
Takeaway for Traders
The May PCE report is a critical litmus test for the Fed’s policy path. Whether it validates a “higher for longer” stance or opens the door to rate cuts, the U.S. dollar will likely be front and center in Friday’s trading. Monitor headline/core PCE, wage data, and Fed speakers to navigate the volatility.
EURUSD – H1 Timeframe
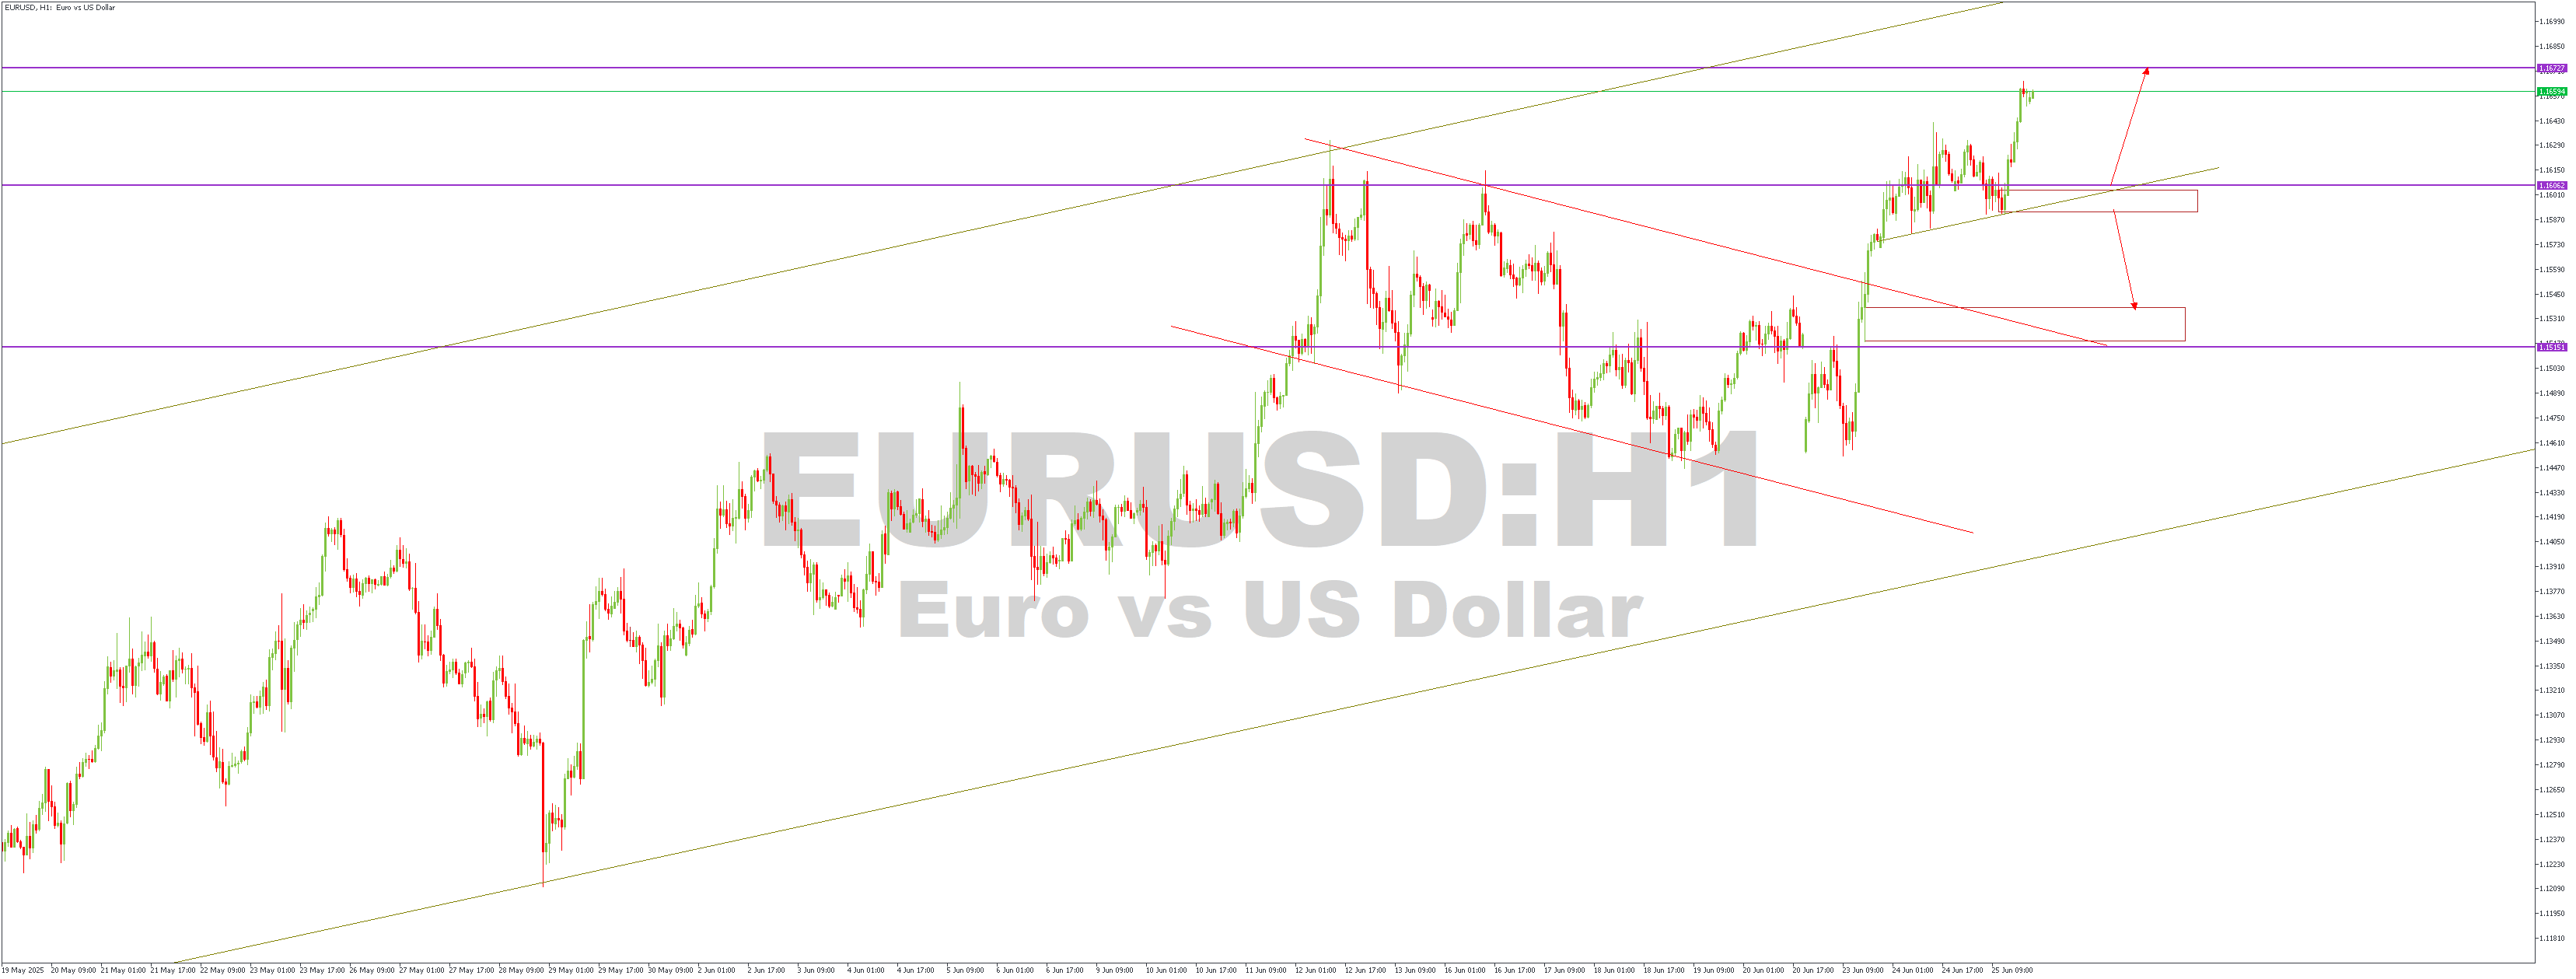
While trading within the overall channel, we see that the price action on the hourly timeframe chart of EURUSD has recently broken out of a secondary channel. This scenario hints at a chance for continued bullish price action. However, since the FVG (Fair Value Gap) created by the momentum from the breakout has not yet been retested, the price action may be inclined to fill up the FVG zone before the bulls reclaim the market.
XAUUSD – H4 Timeframe
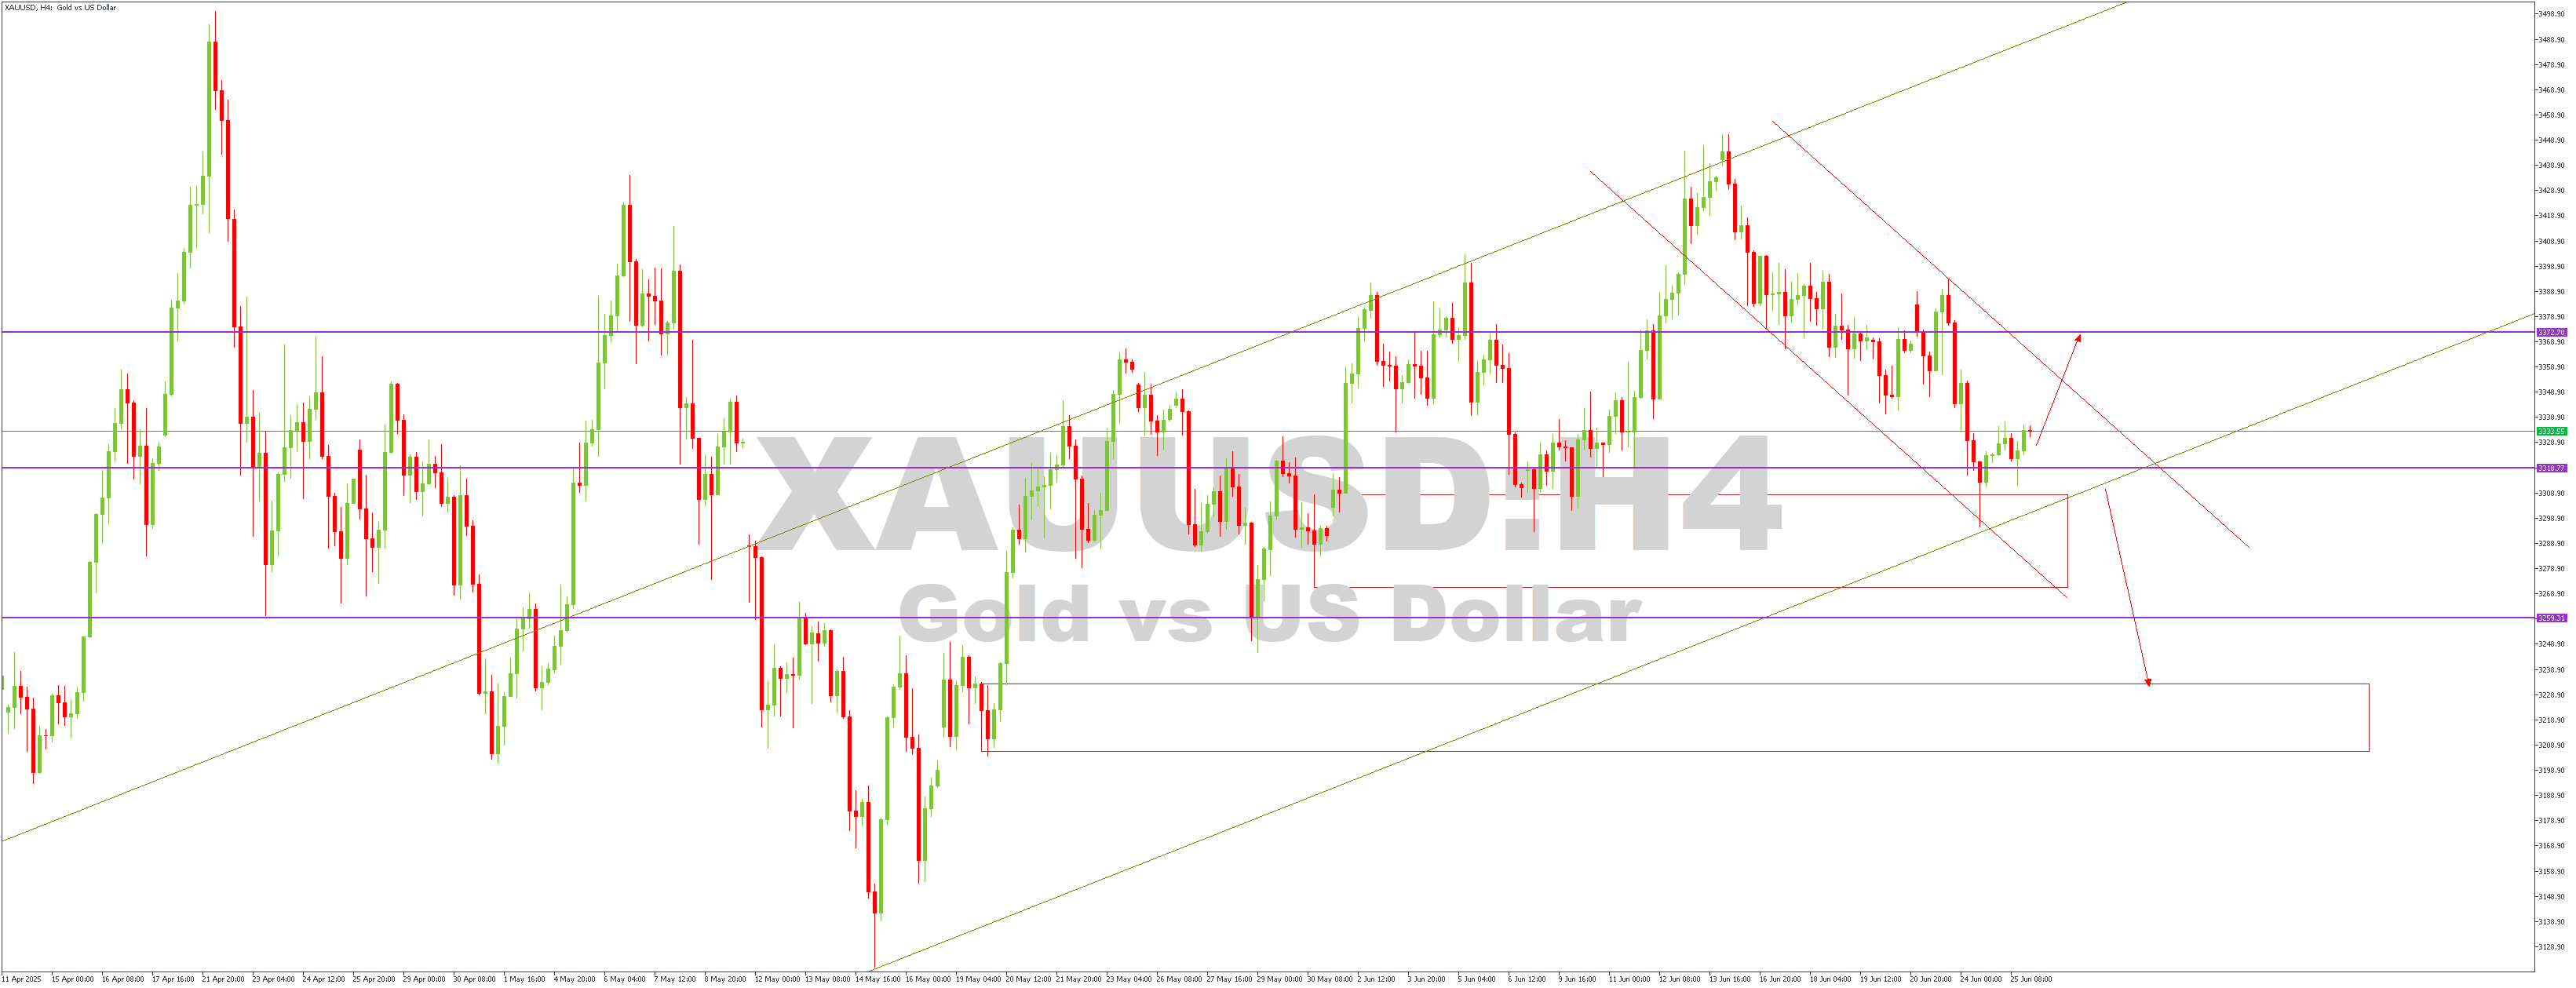
The horizontal lines on the attached 4-hour timeframe chart of XAUUSD are the daily timeframe price action pivots. As seen on the charts, price is trading in a channel within a much larger channel and has recently bounced off the support trendlines of both channels. The ongoing reaction away from the trendlines sets the stage for the bullish continuation, albeit the resistance pivot could threaten the bullish intent.
US100 – H1 Timeframe
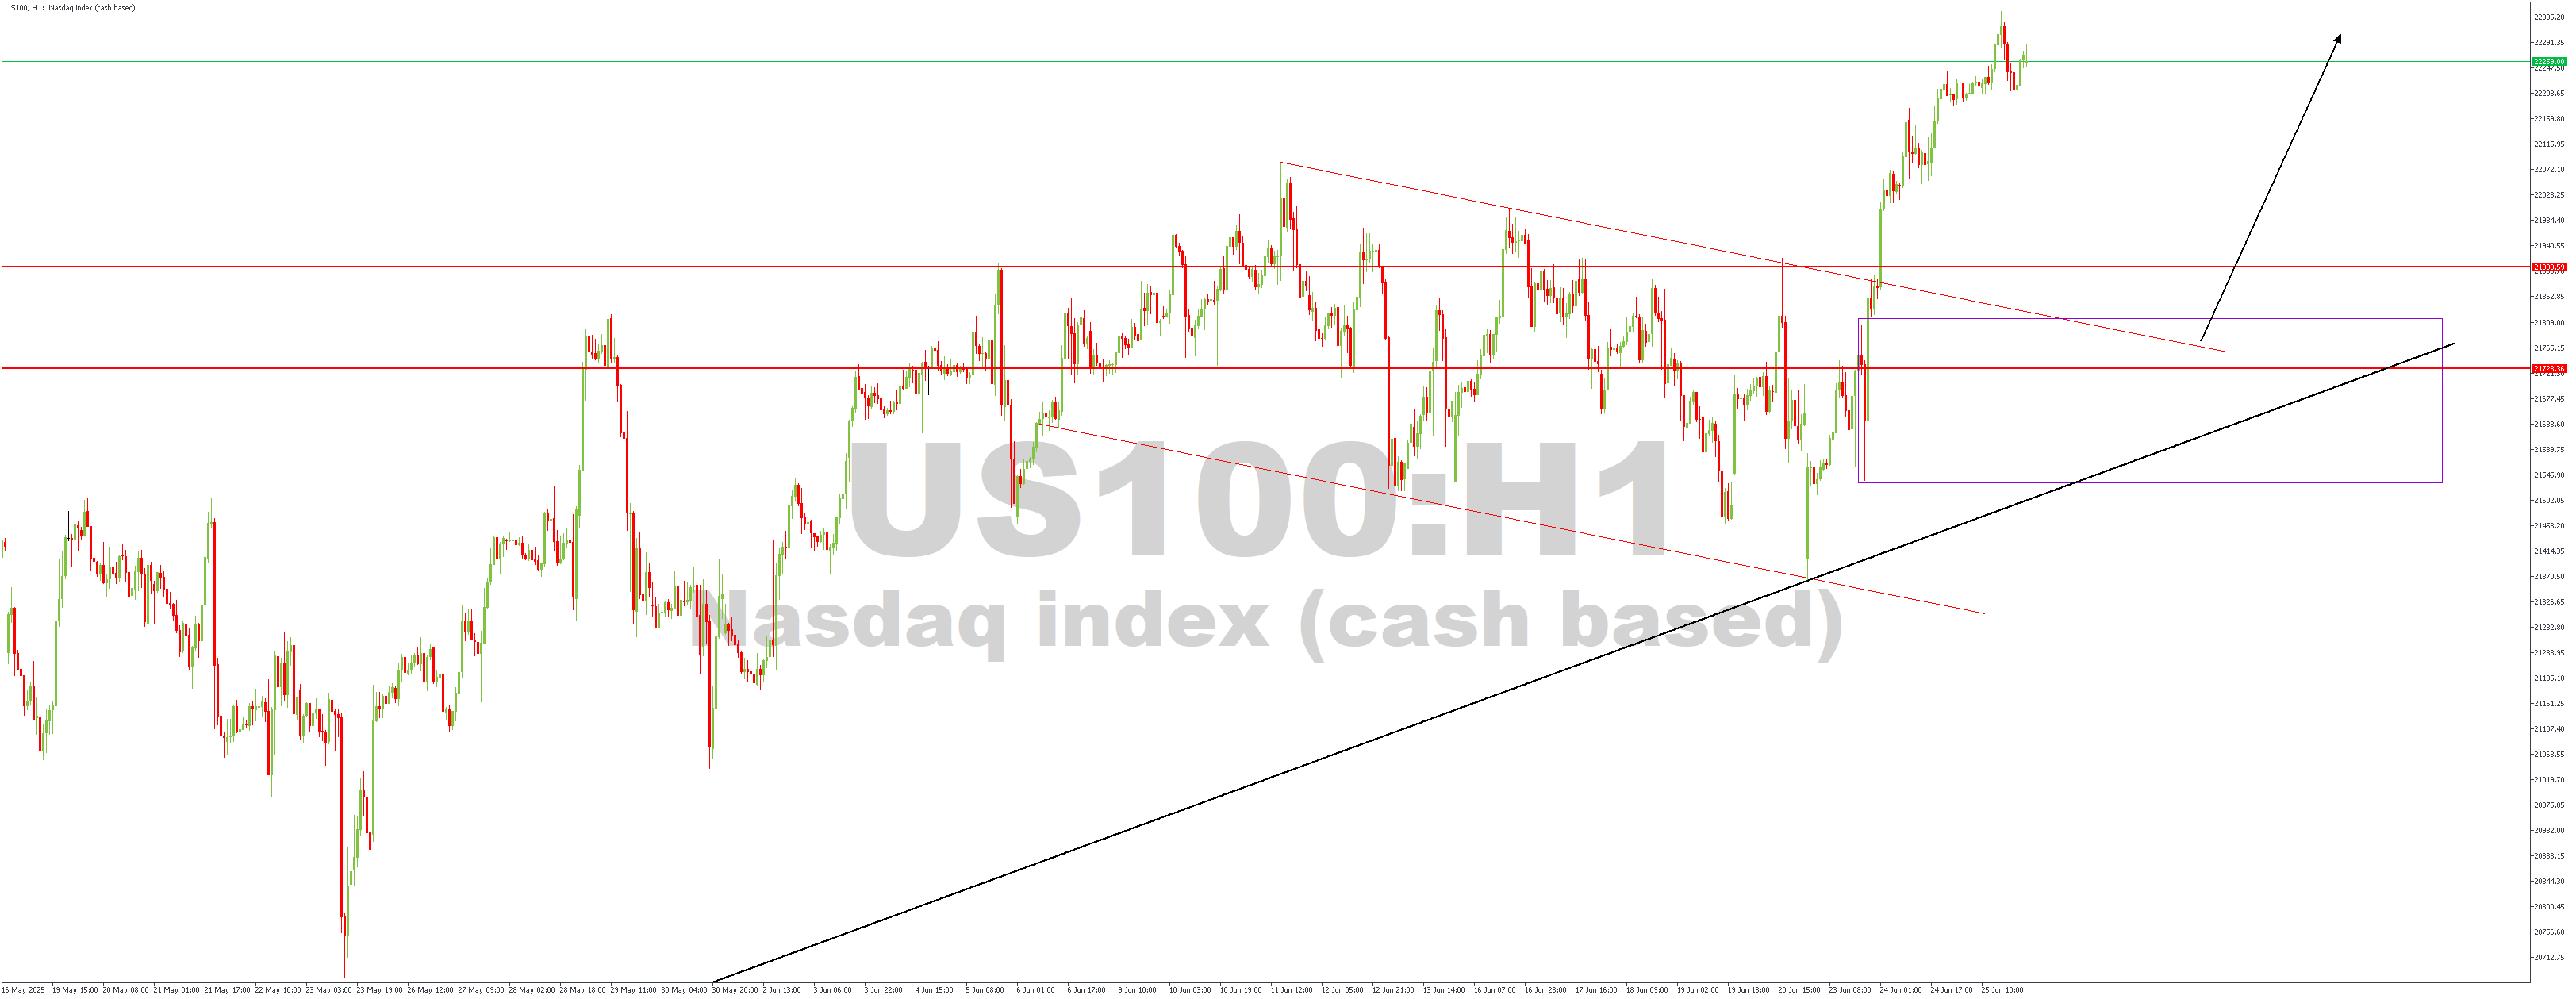
On the 1-hour timeframe chart of US100, we see that price has recently broken above the resistance trendline of the descending channel. The near overlap of the demand zone and the daily timeframe pivot further strengthens the bullish sentiment. In addition, there is a confluence of support trendlines at the demand zone, increasing the likelihood of a bullish outcome.
Direction: Bullish
Target- 22180.43
Invalidation- 21529.66
CONCLUSION
You can access more trade ideas and prompt market updates on the telegram channel.


