Risks and limitations of using AI chatbots in trading
Over-reliance on technology
One of the biggest risks of using AI chatbots in trading is over-reliance on the technology.
Technical issues and glitches
Another risk of using AI chatbots in trading is technical issues and glitches that can impact their accuracy and reliability.
Limited availability of reliable data
Chatbots rely on data to generate insights and recommendations, and the availability of reliable data can be a challenge in some markets.
Privacy and security concerns
Finally, privacy and security concerns are associated with using AI chatbots in trading. Traders should ensure their trading accounts and personal information are secure.
Regulatory and compliance reminders:
Check your broker’s rules on automation before connecting a bot or script.
Only used approved data sources and APIs from your broker or exchange.
Follow local laws and licensing requirements that apply to your trading activity.
Review and respect the platform's terms of service before running automated strategies.
Security and data protection checklist:
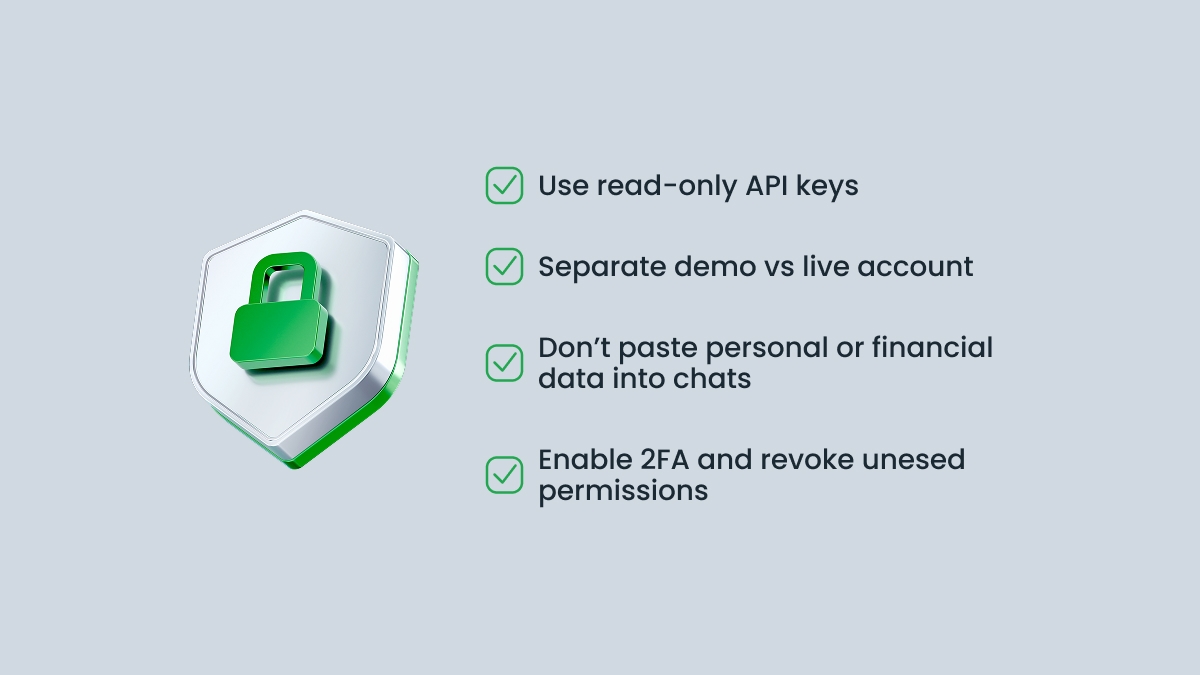
– Use read-only API keys.
– Keep demo and live accounts separate to avoid mistakes.
– Don’t paste personal or financial data into chats.
– Enable 2FA and revoke unused permissions.
How do FBS analysts use AI chatbots?
FBS analysts, just like FBS clients, are developing daily and trying to improve their trading skills and results. Here are three insights that can make a real difference as you trade.
1. Create a trading strategy
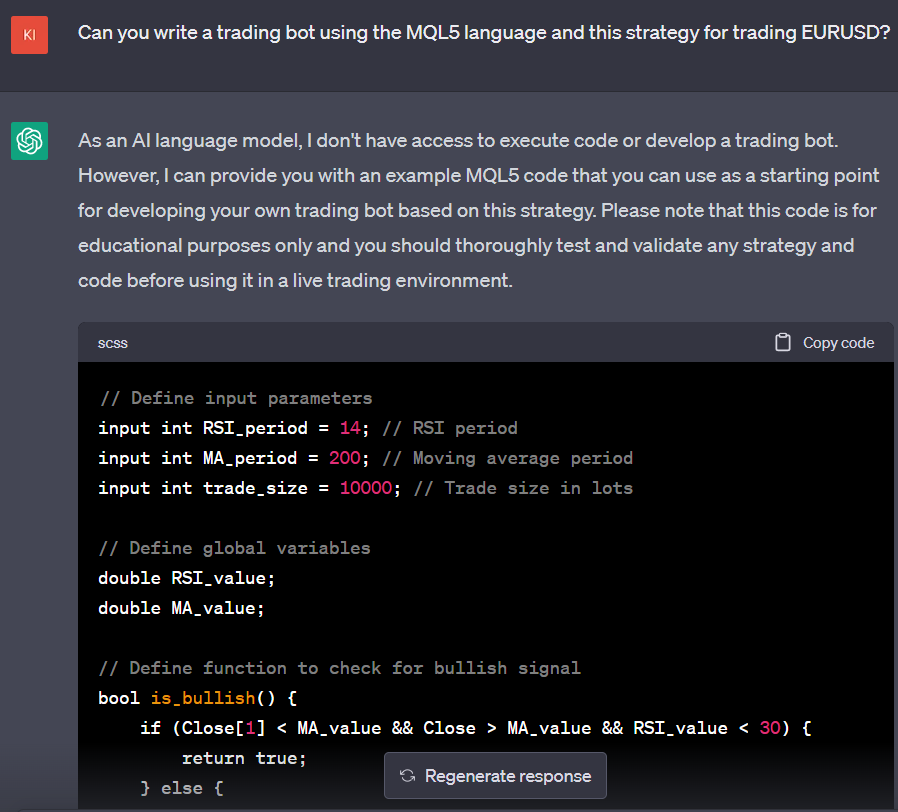
Let's assume you have two indicators you prefer to use but need to know how to combine them into a trading strategy. ChatGPT can solve this problem.
Here is a dialogue:
FBS analyst: Hi, chat! Please give an example of a trading strategy combining the 200-period MA and the RSI.
ChatGPT: Certainly, here's an example of a trading strategy that combines the 200-period moving average (MA) and the Relative Strength Index (RSI):
Identify the trend using the 200-period MA. The trend is bullish if the price is above the 200-period MA. The trend is considered bearish if the price is below the 200-period MA.
Use the RSI to confirm overbought or oversold conditions. An RSI reading above 70 indicates an overbought condition, while an RSI reading below 30 indicates an oversold condition.
Look for a bullish signal when the trend is bullish, and the RSI is oversold. A bullish signal is generated when the price crosses the 200-period MA and the RSI is below 30, indicating a potential trend reversal.
Look for a bearish signal when the trend is bearish, and the RSI is overbought. A bearish signal is generated when the price crosses below the 200-period MA and the RSI is above 70, indicating a potential trend reversal.
Use stop-loss orders to limit losses if the trade goes against you.
Use profit targets to take profits when the trade goes in your favor.
FBS analyst: Where should I put my stop loss using this strategy?
ChatGPT: The placement of your stop loss using this strategy will depend on your risk tolerance, market volatility, and trading goals. Generally, a stop loss is placed below the recent swing low in a bullish trade and above the recent swing high in a bearish trade. This helps limit losses if the market moves against your position.
In the case of this strategy, if you are going long after a bullish signal is generated, you can place a stop loss below the recent swing low or below the 200-period MA, whichever is lower. If you go short after a bearish signal is generated, you can place a stop loss above the recent swing high or above the 200-period MA, whichever is higher.
Isn't it amazing?