Open account
Open accountLog In
Open account

Aug 04, 2025

Strategy

The Fair Value Gap and How to Trade it in Forex

Fair Value Gap

Sometimes, the market moves so fast that buyers and sellers don’t get a fair chance to trade. When this happens, it leaves a price gap. One of the most popular chart patterns in this situation is called the Fair Value Gap (FVG).

In this article, you’ll learn exactly what a Fair Value Gap is, how to spot these gaps on a chart, and how the FVG trading strategy works. You’ll also see a practical example of how to trade on the FVG step by step. Let’s break it all down.

What is a fair value gap?

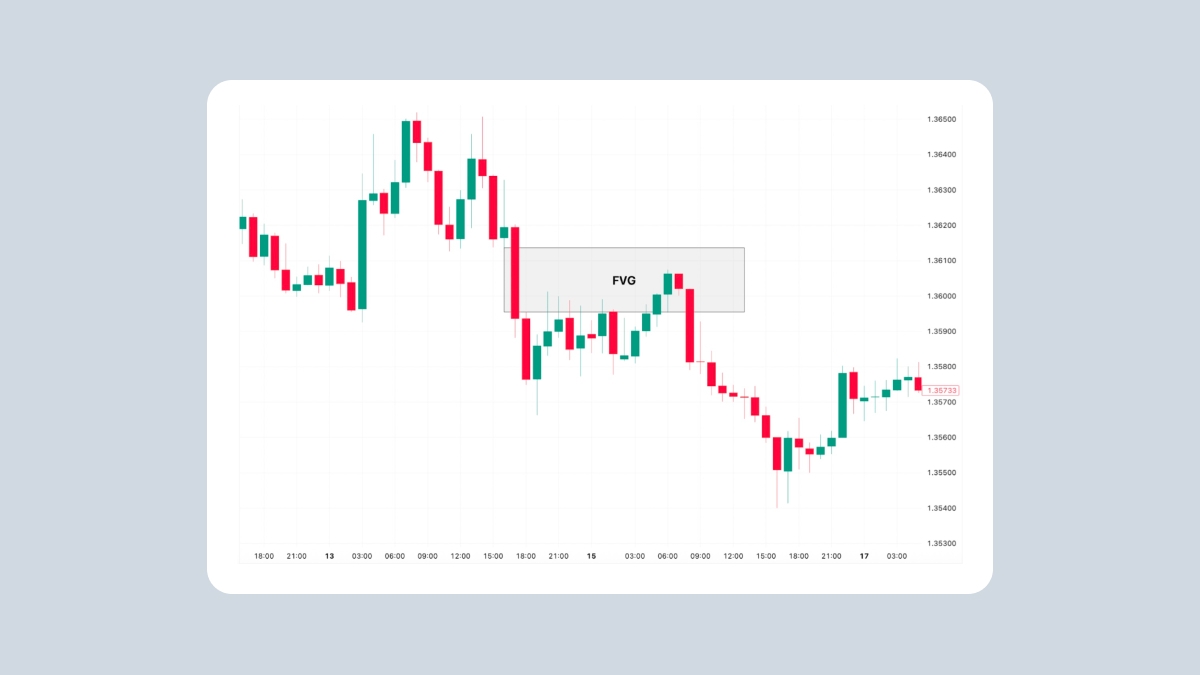
A Fair Value Gap (FVG or price gap) is a pattern on a candlestick chart that shows a strong move up or down. It usually happens when big investors buy or sell quickly, leaving a “gap” with almost no trading. This means the price moved too fast, without giving buyers and sellers a fair chance to trade.

The FVG has three candles. The middle one moves a lot. The first and third candles don’t touch each other, leaving a space between their wicks — that’s the gap.

There are two types of FVGs, depending on how the price moves:

What is a fair value gap?

  1. In a bullish FVG (when the price is going up), the gap is between the high of the first candle and the low of the third. The price often comes back down to fill the gap before going up again.

  2. In a bearish FVG (when the price is going down), the gap is between the low of the first candle and the high of the third. The price often goes back up to fill the gap before dropping further.

How to identify an FVG on a chart

Spotting FVGs on a chart can help you find better trade setups. They often show up before big price moves or pullbacks. It’s helpful to know how to spot them quickly and easily. Follow these simple steps:

  1. FVGs follow a pattern of three candles in a row. So first, look for three candles side by side on the chart.

  2. Check the middle candle: it should be big and show a strong move either up or down.

  3. Now, look for the gap.

For a bullish FVG, the low of the third candle should be higher than the high of the first candle, like in the example below.

How to identify an FVG on a chart

For a bearish FVG, the high of the third candle should be lower than the low of the first candle, like in the chart below.

How to identify an FVG on a chart

The Fair Value Gap trading strategy

The FVG strategy is a simple way to trade using price action. It works in both trending and sideways markets. Since it doesn’t use indicators, focusing only on price movement, many beginners and experienced traders like it.

Here’s the basic approach:

Identify the FVG

First, find three candles in a row on the chart. The middle one should have a strong move up or down. If there’s a clear space between the wicks of the first and third candles, that’s your FVG.

Trade direction

Once you find it, wait for the price to come back to the gap. Don’t rush; the goal is to enter the trade when the price returns to that area and then continues in the same direction. Remember this simple rule:

Candle movementType of FVGWhat to do
Middle candle goes upBullish FVGLook to buy (go long)
Middle candle goes downBearish FVGLook to sell (go short)

Entry options

There are a few ways to enter a trade using an FVG, depending on your risk level:

  • For a safer entry: at the edge of the gap.

  • For a riskier entry: in the middle of the gap.

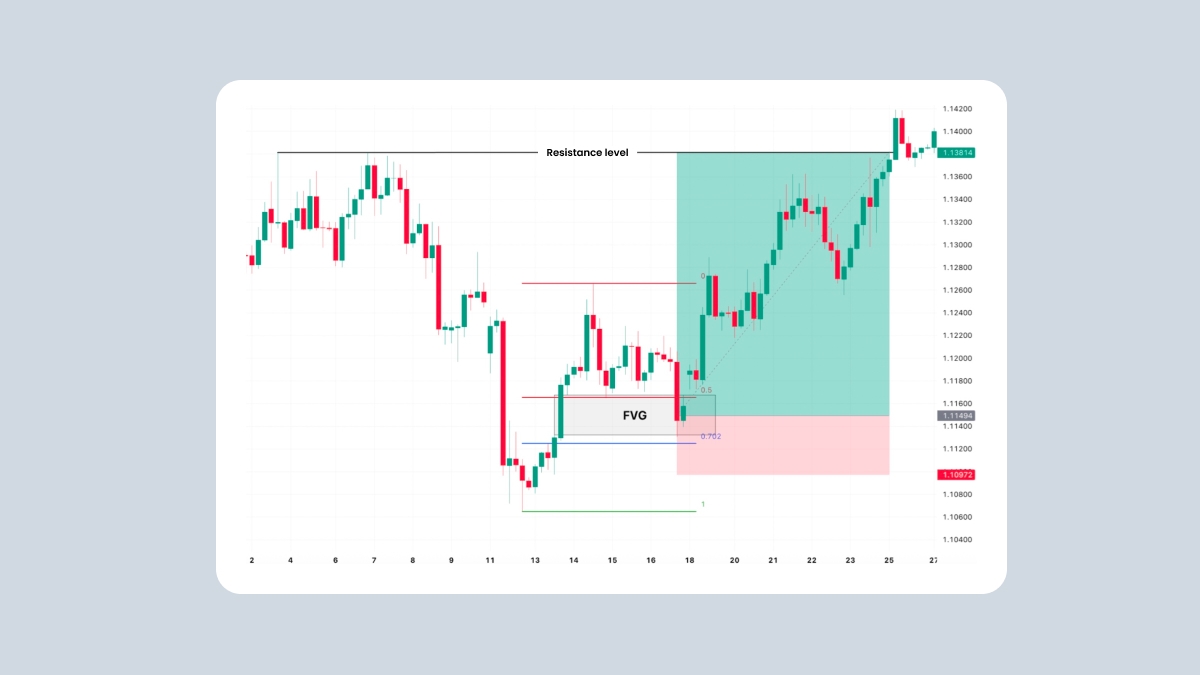
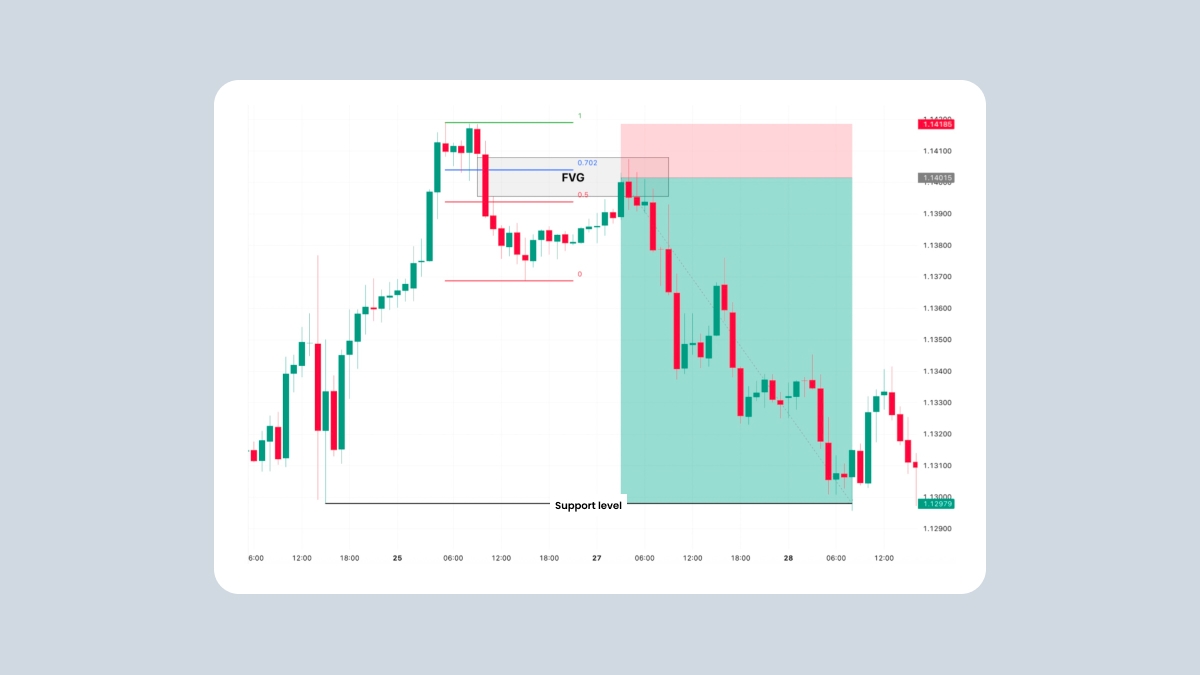
  • Best entry zone: inside the Fibonacci OTE zone, between the 0.5 and 0.702 levels. This zone often gives a better chance of success.

If the price doesn’t come back to the gap within 4 candles, it’s no longer a good setup. Just wait for the next one.

Stop-loss (SL)

To stay safe in your trade and protect your money, always use a stop-loss. For long trades, place it just below the first or middle candle of the FVG. For short trades, put your stop above the first or middle candle. That way, you're covered if the price moves against you.

Take-profit (TP)

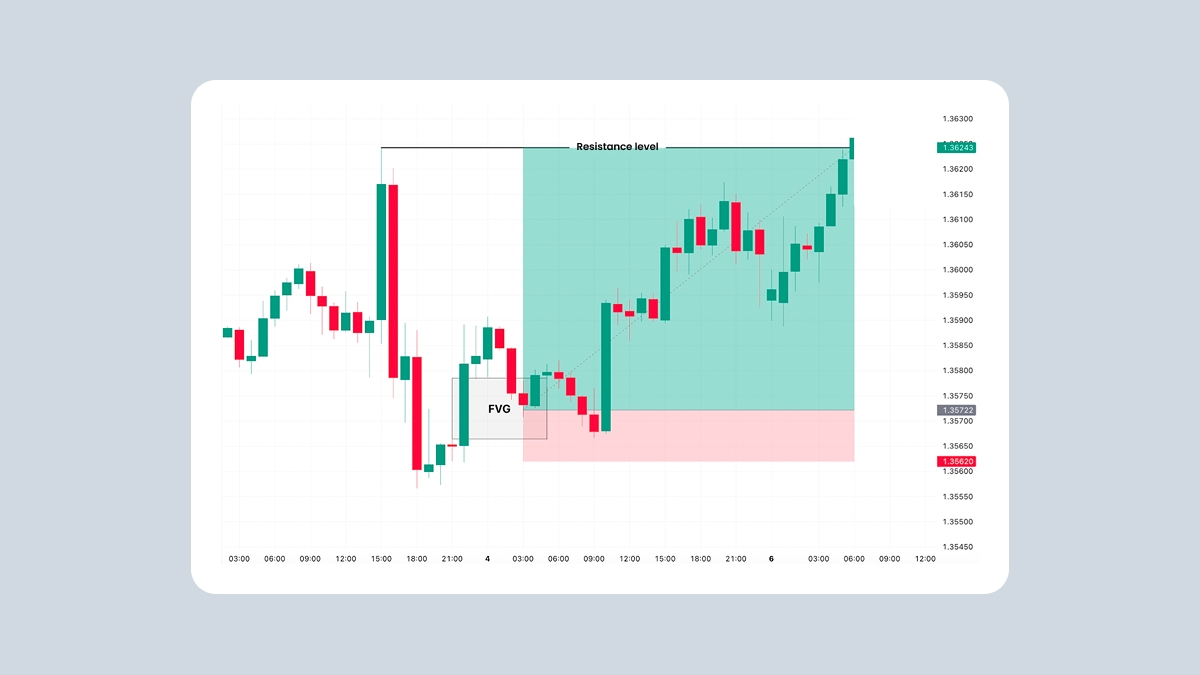
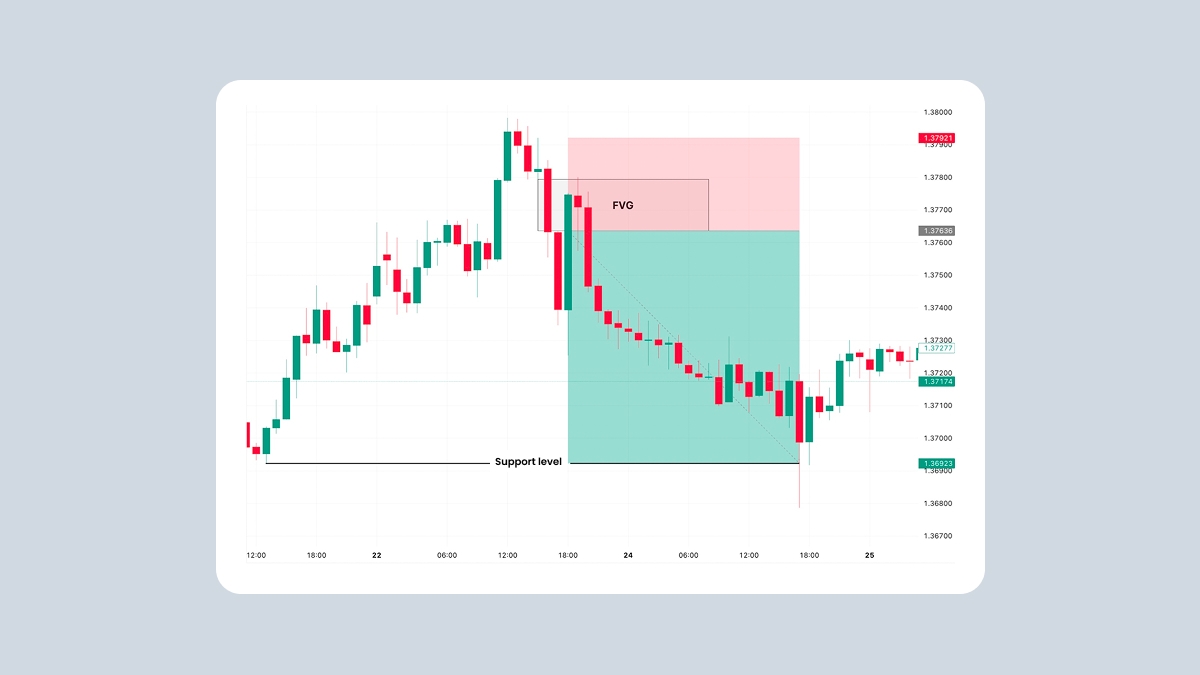
One simple way to take profit is to watch important price levels on the chart. For long trades, you can take profit at a resistance level. For short trades, you can take profit at a support level.

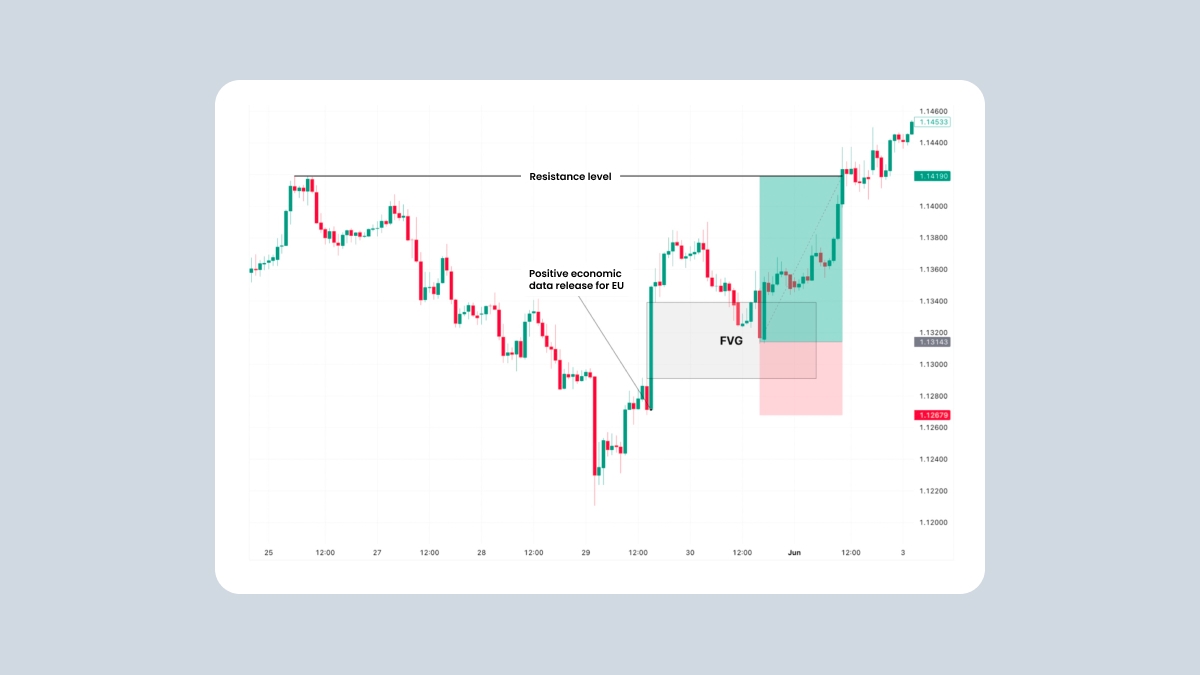
  • In a bullish setup, the price moves back into the FVG and then goes up until it hits the resistance. That’s a good place to set your take-profit:

The Fair Value Gap trading strategy

  • In a bearish setup, the price comes back to the FVG and then drops down to the support level. That’s your profit zone:

The Fair Value Gap trading strategy

Another smart Forex strategy is to enter trades when the FVG lines up with the Fibonacci OTE zone (between 0.5 and 0.702). When the price retraces into this area, it’s often seen as a safer and stronger setup with better potential.

The Fair Value Gap trading strategy

The Fair Value Gap trading strategy

FVG vs liquidity voids and related concepts

FVG vs liquidity void:

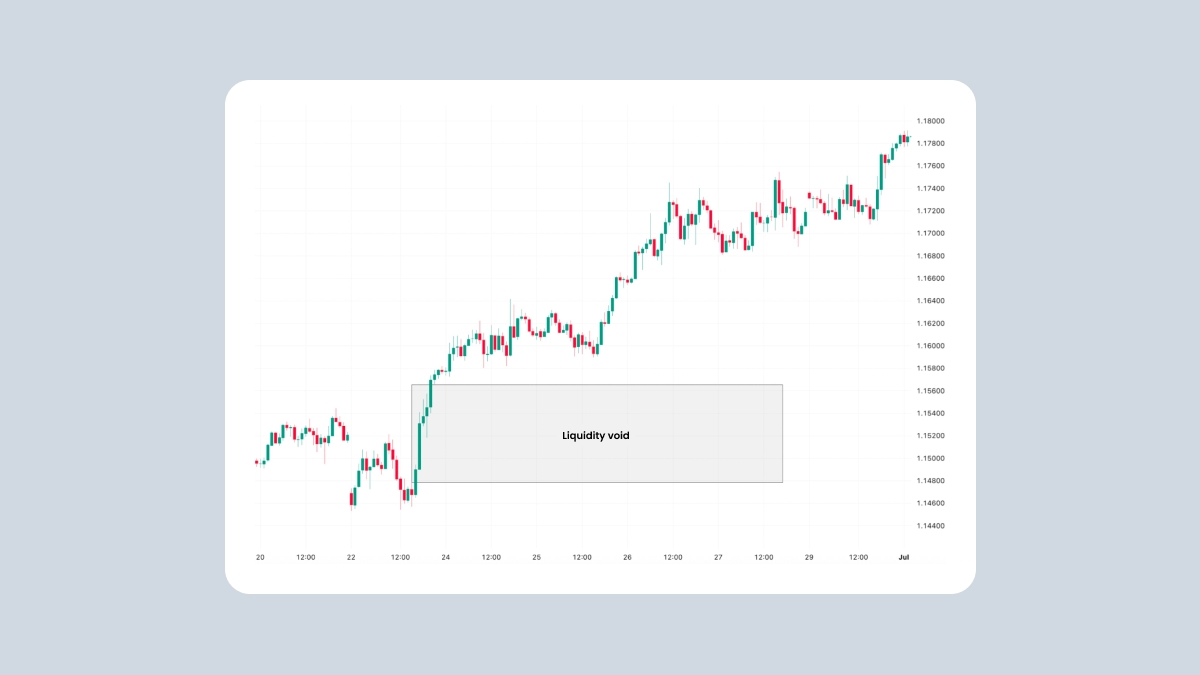
Fair Value Gap (FVG) and Liquidity Void are similar but not the same. Both show an imbalance between buyers and sellers that causes a fast price move with little or no pause. But they have key differences, such as:

Fair Value Gap

An FVG is usually a three-candle pattern on the chart. It shows a short-term gap where one side (buyers or sellers) had much more pressure than the other.

Liquidity Void

A Liquidity Coid is a bigger version of that. It covers a large part of the chart, often includes many FVGs, and shows a stronger price move. Liquidity Voids are less likely to be filled quickly.

Timeframe matters too. FVGs are clear on lower timeframes, while Liquidity Voids often appear as one large zone on higher timeframes. Both are useful for spotting retracements or entry zones.

FVG vs liquidity voids and related concepts

FVG vs liquidity voids and related concepts
Liquidity Void vs FVG

FVG vs Regular Gaps:

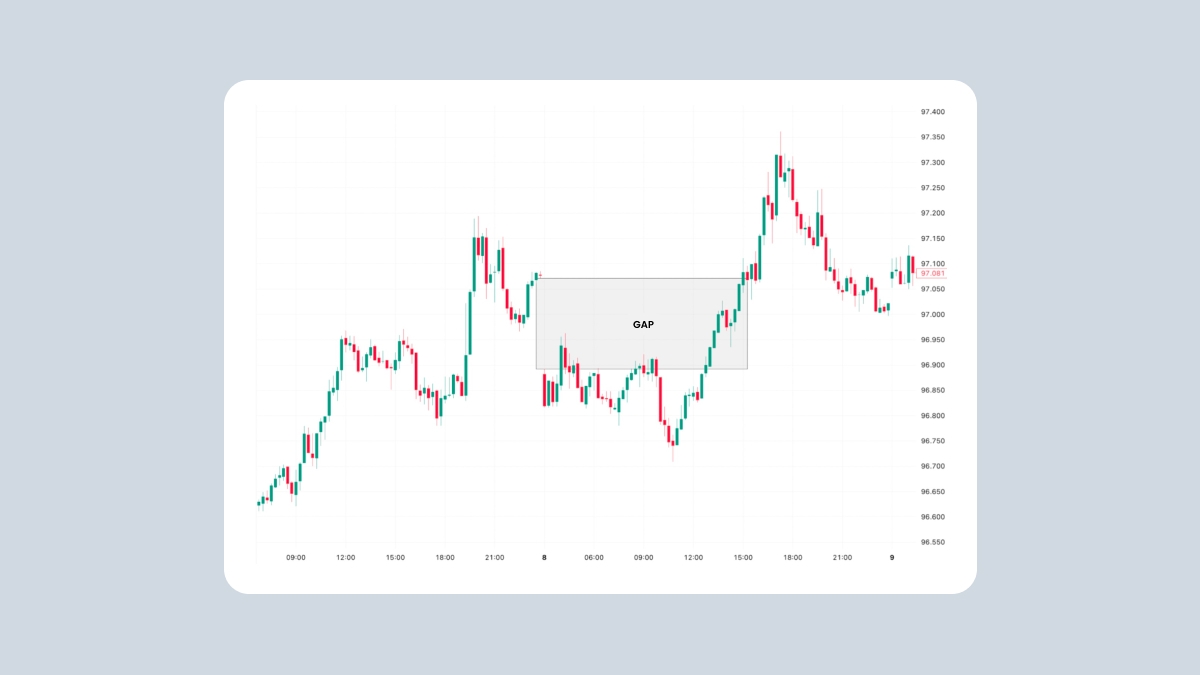
Regular Gaps happen at market open, usually because of news or events after hours. They appear between the close of one session and the open of the next. These gaps are common in quiet markets and often get filled quickly, offering fewer trading setups.

Fair Value Gaps (FVGs) form during active trading, when buyers or sellers take control. They show a price imbalance, often caused by big players. Price may come back to these areas before moving on.

Regular gaps are fast and event-driven. FVGs are part of price action and offer more planned trading opportunities.

FVG vs Regular Gaps
Open market regular gap

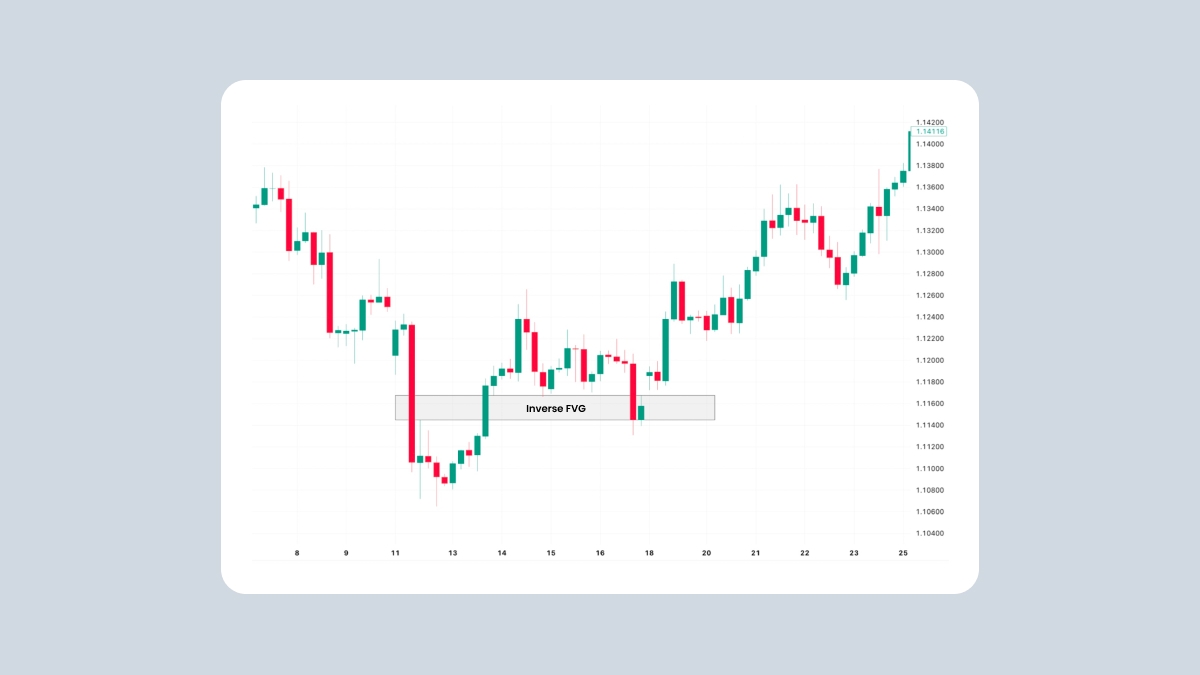
Inverse fair value gap

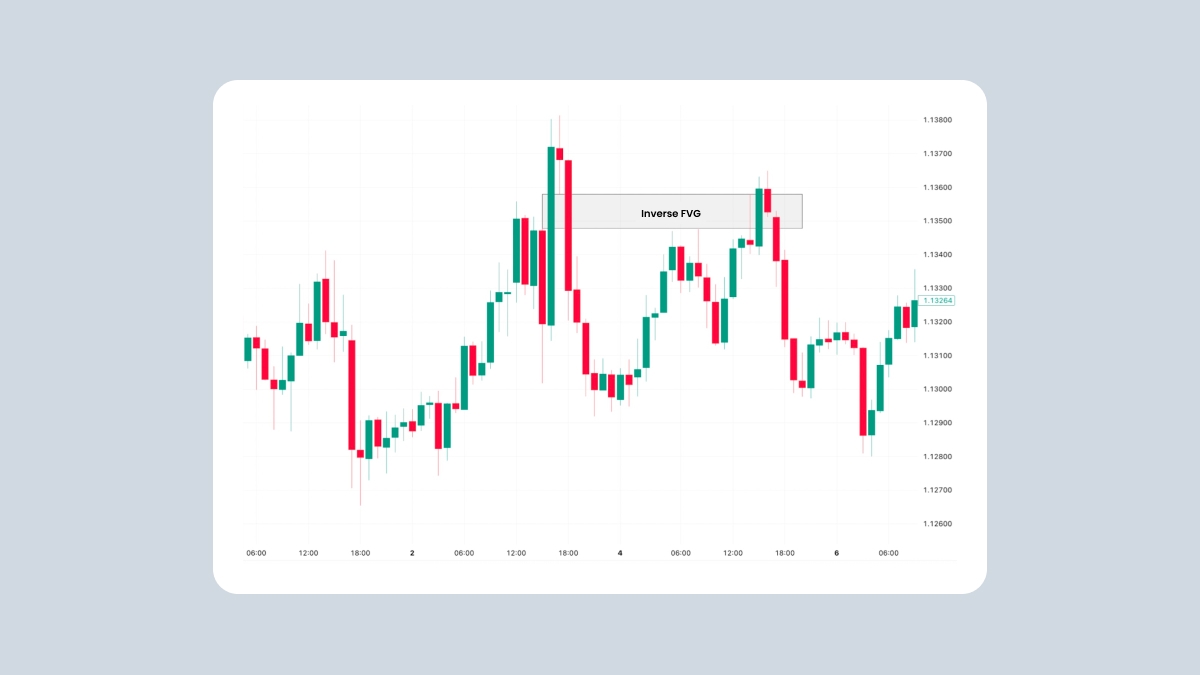
Regular FVGs show a gap that price may come back to fill. Inverse FVGs form after the gap is filled and price moves strongly in the opposite direction. At that point, the same zone can switch roles:

  1. If it was a bearish FVG, it might turn into support.

  2. A bullish FVG can become a resistance area.

This can show strong momentum or a shift in market sentiment. The price usually doesn’t return to this area again. Instead, these patterns can confirm that the price is likely to keep moving in the same direction. Traders use inverse FVGs to spot trend continuation or breakout setups.

Inverse fair value gap

Inverse fair value gap
Inverse bearish/bullish FVG

Ready to use this in real trades? Start trading Fair Value Gaps and more with FBS.

Practical example of trading on Fair Value Gaps

You can find FVGs on different timeframes and in all kinds of market situations. For example, let’s say you’re looking at a 1-hour chart of EUR/USD. After some positive economic news, the price shoots up quickly, creating a bullish FVG. This happens because buyers suddenly take control, and the price moves too fast for sellers to catch up.

Later, the price comes back down and fills the gap (it returns to the FVG zone). This is a common move, as the market often comes back to balance supply and demand. After filling the gap, the price starts going up again and continues its trend.

Practical example of trading on Fair Value Gaps

Risks and limitations

Fair Value Gaps are useful, but not perfect. Trading FVGs can be profitable, but it also comes with risks that traders need to understand:

  • Some FVGs don’t get filled, and price may just keep moving without looking back. That can lead to missed trades or losses.

  • Prices can move very fast in volatile markets, making it hard to react in time. This can cause slippage or invalidate your setup.

  • An FVG that looks important on a small timeframe might not matter on a larger one, so it’s important to check on the overall context.

  • Sometimes price returns to the FVG zone just to trick traders, then quickly reverses. This can happen when big players are collecting liquidity.

Relying only on FVGs is risky. It’s better to use them together with other tools like trend structure, Fibonacci, or momentum indicators. Want to try it yourself? FBS makes it easy to start trading, with a beginner-friendly platform and all the tools pros need to open great trades.

Share with friends:

Open an FBS account

By registering, you accept FBS Customer Agreement conditions and FBS Privacy Policy and assume all risks inherent with trading operations on the world financial markets.

FBS at social media

iconhover iconiconhover iconiconhover iconiconhover icon

Contact us

iconhover iconiconhover iconiconhover iconiconhover icon
store iconstore icon
Get on the
Google Play
store iconstore icon
Get MT4 on the
App Store
store iconstore icon
Get MT5 on the
App Store

Trading

Company

About FBS

Our social impact

Legal documents

Company news

FC Leicester City

Help Center

Partnership programs

The website is operated by FBS Markets Inc.; Registration No. 000001317; FBS Markets Inc. is registered by the Financial Services Commission under the Securities Industry Act 2021, license number 000102/31. Office Address: The Bentley, #16 Cor A Street & Princess Margaret Drive, Belize City, Belize.

FBS Markets Inc. does not offer financial services to residents of certain jurisdictions, including, but not limited to: the USA, the EU, the UK, Israel, the Islamic Republic of Iran, Myanmar.

Payment transactions are managed by HDC Technologies Ltd.; Registration No. HE 370778; Legal address: Arch. Makariou III & Vyronos, P. Lordos Center, Block B, Office 203, Limassol, Cyprus. Additional address: Office 267, Irene Court, Corner Rigenas and 28th October street, Agia Triada, 3035, Limassol, Cyprus.

Contact number: +357 22 010970; additional number: +501 611 0594.

For cooperation, please contact us via [email protected].

Risk Warning: Before you start trading, you should completely understand the risks involved with the currency market and trading on margin, and you should be aware of your level of experience.

Any copying, reproduction, republication, as well as on the Internet resources of any materials from this website is possible only upon written permission.

The information on this website does not constitute investment advice, a recommendation, or a solicitation to engage in any investment activity.