The US dollar held steady after June’s core PCE came in at 2.8% y/y, slightly above forecast (2.7%). The monthly print of +0.3% m/m aligned with expectations, limiting immediate volatility. For EURUSD, the pair is consolidating between 1.0850 support and 1.0970–1.1000 resistance; a softer July PCE outcome could trigger upside momentum. USDJPY trades near 153.50, with upside capped at 154.00; a hotter print may push yields higher, lending short-term support to the dollar.
Fundamental Factors Affecting the Dollar
- Current Print (June 2025): Core PCE inflation stood at 2.8% y/y, slightly firmer than expected (Investing.com, Trading Economics). The 0.3% m/m gain aligned with forecasts (Advisor Perspectives).
- Forward Outlook (July 2025): Economists expect core PCE to edge up to 2.9% y/y (Investopedia), signaling persistence rather than meaningful disinflation.
- Policy Implications: While headline inflation has cooled, core inflation remains well above the Fed’s 2% target. This complicates the policy narrative:
- A rise to 2.9%+ would weaken September rate-cut bets.
- A steady or softer print would revive expectations for Fed easing into year-end.
- Market Sentiment: Investors remain cautious. They see limited near-term downside for yields but acknowledge risks of policy misalignment if inflation proves sticky.
Key Takeaway for Traders
June’s 2.8% core PCE print underscores the Fed’s challenge: inflation is easing broadly but not enough in the core to justify aggressive rate cuts fully. For traders, this sets up event-driven volatility around the July release. If core PCE rises toward 2.9%, the dollar could strengthen—favoring short-term USDJPY upside and EURUSD downside. Conversely, a stable or softer outcome reinforces the dovish tilt, opening room for a EURUSD breakout above 1.10 and a USDJPY pullback.
EURUSD H8 Timeframe
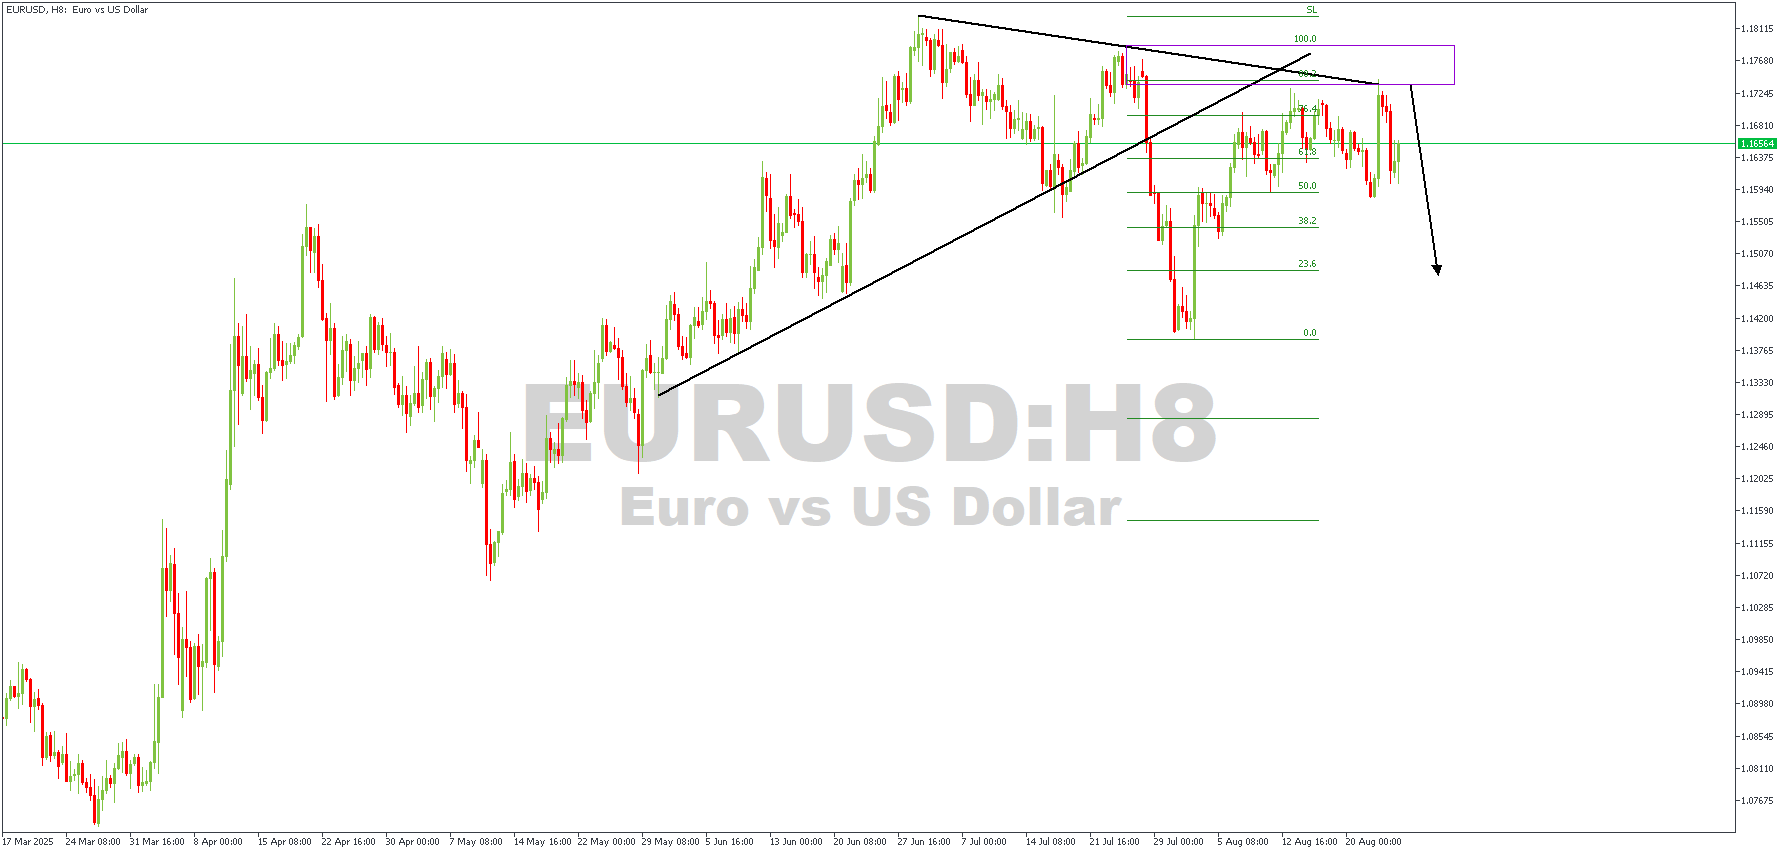
On this EURUSD H8 chart:
Price attempted to break higher into the 1.1760 – 1.1780 resistance zone (purple box), but the move stalled right at the descending trendline (black line) that has capped rallies for weeks. Notice how each push upward has been weaker, hinting that buyers are running out of steam.
After the rejection, the price is trading back below the trendline confluence and leaning toward the Fibonacci retracement levels. The chart gives the impression of a failed breakout setup, which often fuels momentum in the opposite direction.
Direction: Bearish
Target- 1.15723
Invalidation- 1.17915
USDJPY H8 Timeframe
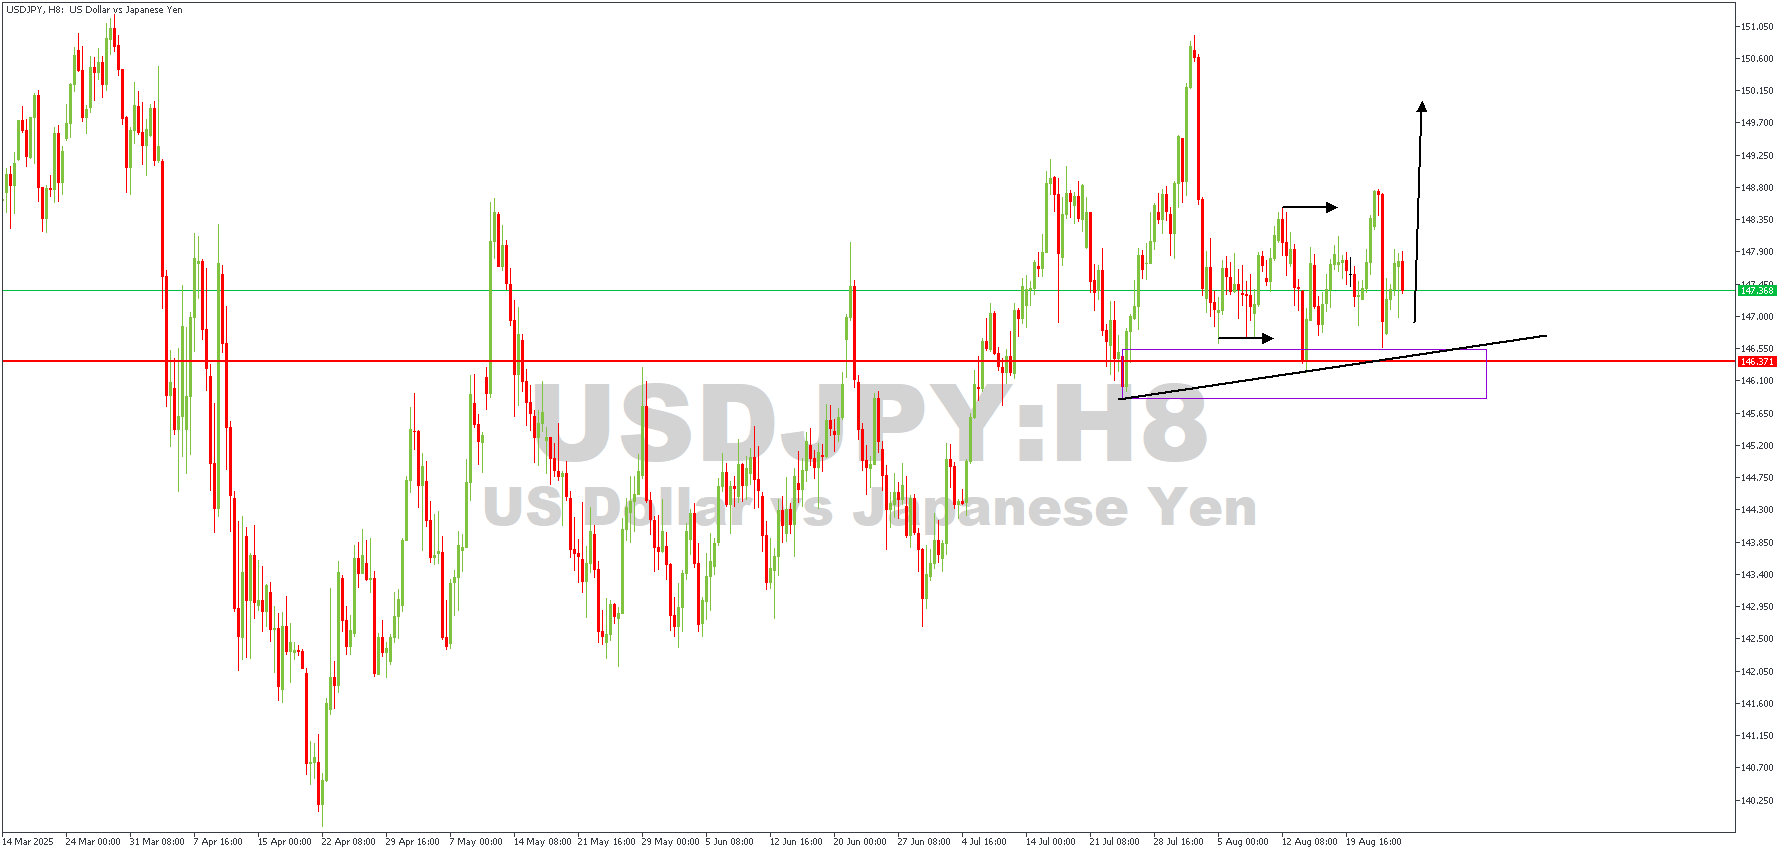
On this USDJPY H8 chart:
Price is consolidating above the ascending trendline support (black line), showing buyers still defending higher lows. Recently, the market bounced strongly from the 147.00 area and is now testing the short-term consolidation range (the arrows mark this sideways movement).
This price action looks like a coiled spring — the more it builds up pressure between higher lows and a horizontal ceiling, the bigger the breakout move tends to be.
If bulls keep control above 147.00, the breakout could drive price toward the 148.80 – 149.20 resistance zone, potentially higher.
Conversely, the ascending structure would break if the pair loses 146.40 (red line support), opening a path back toward 145.50 – 145.00 (purple box support).
Direction: Bullish
Target- 147.800
Invalidation- 145.650
CONCLUSION
You can access more trade ideas and prompt market updates on the Telegram channel.


