The US dollar initially strengthened on the headline 3.0% GDP rebound. Still, traders quickly looked under the hood: real final sales to private domestic purchasers slowed to 1.2% (from 1.9% in Q1), suggesting soft private-sector momentum. For EURUSD, resistance sits near 1.0970–1.1000, with support at 1.0850. A muted growth outlook alongside easing inflation may weigh on the dollar over the medium term, especially if Fed rate cut bets accelerate. Meanwhile, USDJPY remains sensitive to yields, with support at 152.20 and resistance at 154.00.
Fundamental Factors Affecting the Dollar
- GDP Growth: Q2 advanced estimate showed +3.0% annualized growth, reversing Q1’s –0.5% contraction (BEA). However, much of the rebound came from lower imports and consumer spending, not broad-based investment.
- Underlying Demand: Core private domestic demand grew just 1.2%, pointing to weak momentum once volatile trade effects are stripped out (BEA, EY). Averaging Q1 and Q2 puts H1 growth near 1.1%, a subdued pace.
- Inflation Trends: Price pressures eased sharply—GDP price index rose 1.9% (vs. 3.4%), PCE 2.1% (vs. 3.7%), and core PCE 2.5% (vs. 3.5%) (BEA). This softening bolsters the Fed’s case for eventual rate cuts.
- Market View: Analysts (FT, MarketWatch, Investopedia) argue the GDP rebound is more statistical than structural, warning that momentum could fade without more substantial investment and exports.
Key Takeaway for Traders
The Q2 GDP rebound gives the US economy breathing room, but doesn’t mask the fact that private demand is cooling. For forex markets, the softer core growth and easing inflation reinforce the outlook for Fed dovishness into late 2025. Traders should watch EURUSD near 1.10 for a potential breakout if dollar sentiment turns weaker, while USDJPY could retreat if yields soften further. Ultimately, this GDP report suggests dollar strength may be short-lived without a meaningful pickup in private demand.
US Dollar Index H4 Timeframe
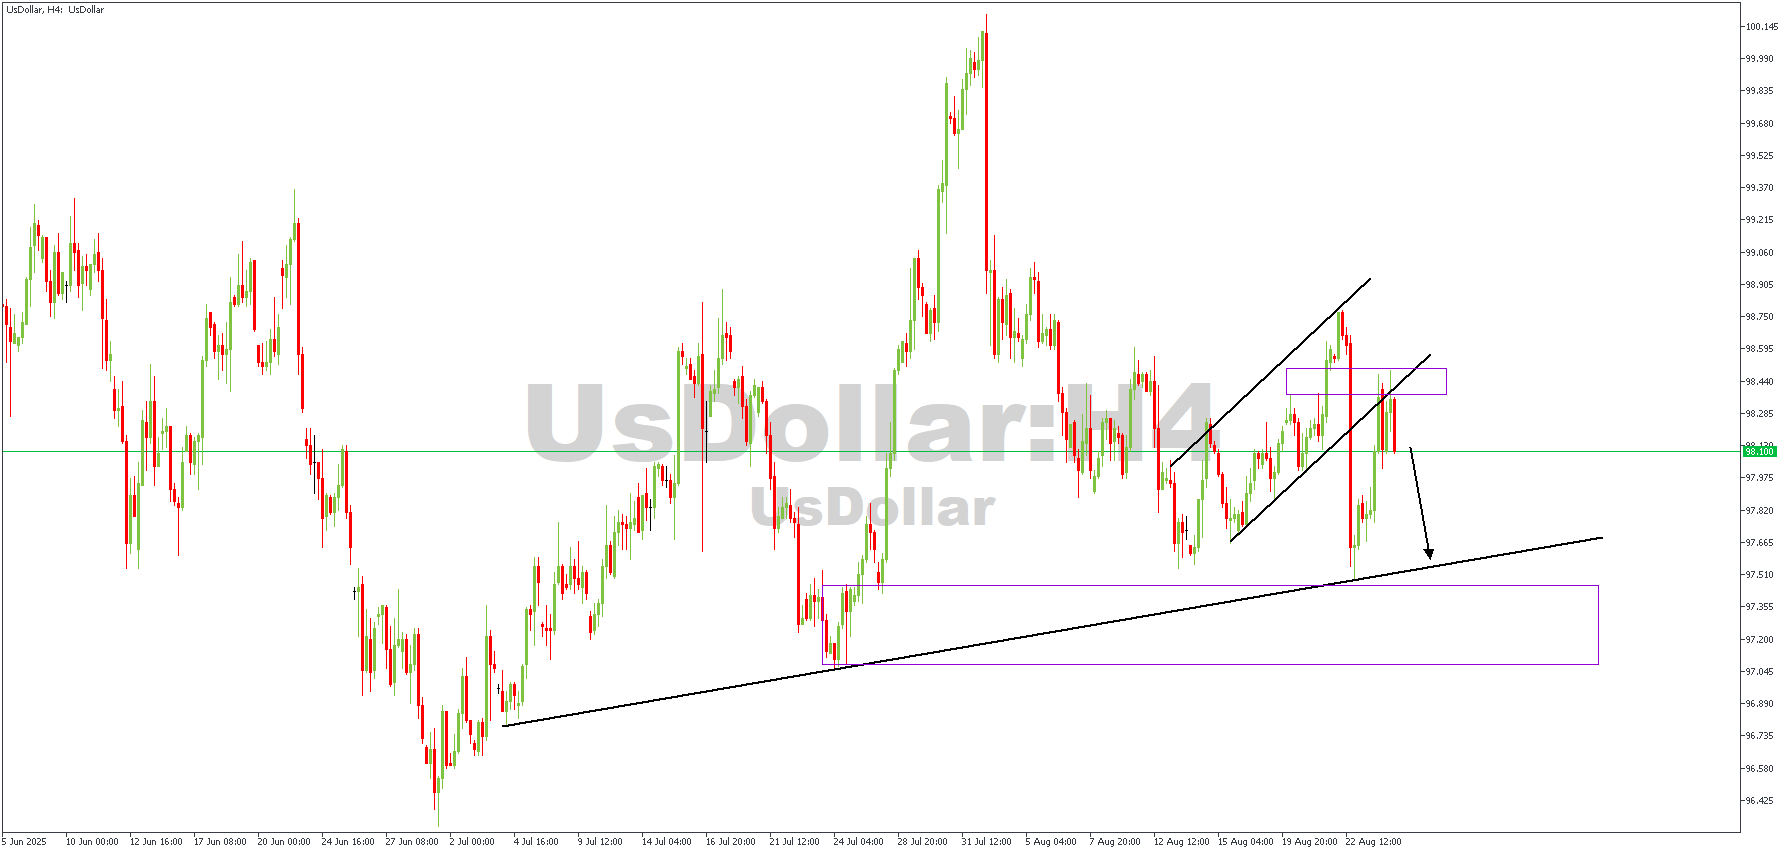
On this USD Index H4 chart:
Price has recently broken below the rising channel, signaling that bullish momentum is weakening. After the breakdown, it retested the previous support, turned resistance zone around 98.40 – 98.55 (highlighted box), and rejected it cleanly — a classic bearish confirmation.
The rejection suggests sellers are taking control, and the chart points toward a likely downward continuation. The immediate downside objective is the ascending trendline near 97.70 – 97.80, which has acted as a strong dynamic support in the past.
If that level breaks decisively, the next bearish target would be the broader support zone marked around 97.10 – 97.35 (purple box).
CONCLUSION
You can access more trade ideas and prompt market updates on the Telegram channel.


