Shares of MFA Financial Inc. rose by 2.13% on Wednesday, closing at $10.07, as part of an intense overall day for the stock market. The NASDAQ Composite Index climbed 2.45% to 19,511.23, while the Dow Jones Industrial Average increased 1.65% to 43,221.55. This marked the second day in a row of gains for MFA Financial. However, the stock is still trading 25.13% below its 52-week high of $13.45 on September 19. Compared to its peers, MFA’s performance was mixed, with competitors like PennyMac Mortgage Investment Trust gaining 2.12%, Invesco Mortgage Capital gaining 2.33%, and AGNC Investment Corp. climbing 1.62%.
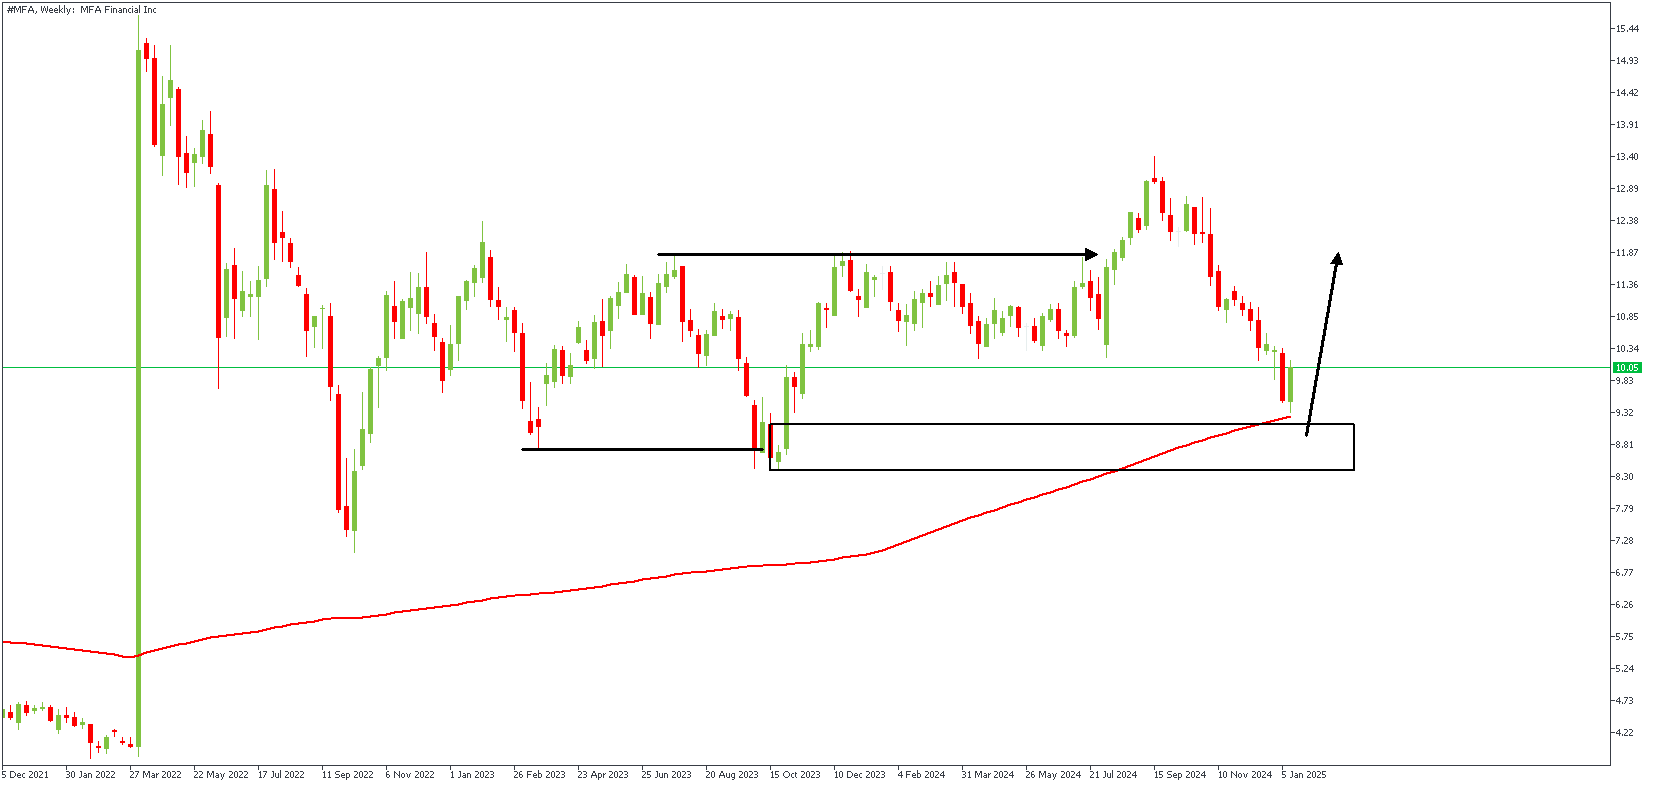
MFA – W1 Timeframe

On the Weekly timeframe, we see the 200-period moving average intersecting with the drop-base-rally demand zone and the price approaching this confluence region, which aligns with the 82% Fibonacci retracement level. This readily provides sufficient precedence for a bullish sentiment, albeit a lower timeframe entry confirmation wouldn’t hurt.
MFA – D1 Timeframe
.png)
On the daily timeframe chart, we see price trading within a wedge pattern while approaching the demand zone of an SBR pattern. The logical conclusion fits right into the higher timeframe narrative of a bullish sentiment.
Analyst’s Expectations:
Direction: Bullish
Target: 12.24
Invalidation: 8.10
CONCLUSION
You can access more trade ideas and prompt market updates on the telegram channel.


