US CPI Snapshot
- June 2025 (latest released):
- Headline CPI YoY: 2.7%, up from 2.4% in May.
- Monthly change: +0.3% MoM.
- Core CPI YoY (ex-food & energy): ~2.9% YoY, ~+0.2% MoM.
- July 2025 (Consensus Forecast):
- Headline CPI: ~2.8% YoY.
- Core CPI MoM: ~+0.3%.
- Inflation Expectations:
- The New York Fed's Survey of Consumer Expectations shows a rise in long-term expectations:
- 5-year ahead: 2.9% (up from 2.6%).
- 1-year ahead: 3.1%.
US CPI data for June 2025 showed headline inflation rising to 2.7% YoY from 2.4% in May, with a +0.3% monthly gain. Core CPI, excluding food and energy, climbed ~2.9% YoY and +0.2% MoM, signaling that underlying price pressures remain persistent. According to Barron's, Reuters, and Bloomberg surveys, consensus forecasts for July point to a slight uptick in headline CPI to ~2.8% YoY and a firmer +0.3% MoM core reading.
Long-term inflation expectations have also shifted, with the New York Fed's 5-year outlook rising to 2.9% from 2.6%, and the 1-year ahead measure at 3.1%. Economists warn that such moves risk entrenching inflation psychology, potentially leading to firmer wage demands and more aggressive price-setting behavior.
For the Federal Reserve, the combination of sticky core inflation, tariff-driven cost pressures, and rising expectations complicates the case for near-term easing. New US tariffs are expected to lift core PCE inflation by 0.2–0.3 percentage points, with Goldman Sachs projecting year-end core inflation could hover around 3.1–3.3%. This dynamic has shifted market pricing toward a delayed start to rate cuts, potentially not until fall 2025.
With the July CPI report due August 12, traders are preparing for elevated volatility. A hotter print could push US yields higher and further delay policy easing, while a softer outcome might revive hopes for a September cut. The CPI release is now a key macro catalyst for both rates and broader risk sentiment.
Economic & Policy Implications
- Persistent Inflation Pressure
- The upward drift in headline and core inflation signals that price pressures remain entrenched, mainly as tariffs and shelter costs feed through. Core inflation is near 3%, notably above the Fed's 2% target.
- Risks to Fed Easing Timeline
- Cooling CPI may offer some relief, but core CPI strength and sticky inflation expectations complicate monetary policy easing. The Fed is likely to delay rate cuts—possibly until the fall of 2025—as policymakers await a more evident, sustained decline in inflation.
- Tariff-Driven Inflation
- New US tariffs are expected to feed into consumer prices, particularly through core measures. Some analysts, including Goldman Sachs, estimate that tariffs could lift core PCE inflation by up to 0.2–0.3 percentage points, raising year-end core inflation estimates toward 3.1–3.3%.
- Inflation Expectations Rising
- The increase in long-term expectations to 2.9% (from 2.6%) particularly worries the Fed. If consumers and businesses expect higher inflation to persist, that may harden price-setting behavior and wage demands, creating a feedback loop that central bankers are keen to avoid.
- Markets on Edge Ahead of CPI Release
- With the July CPI report due August 12, markets are bracing for volatility. A hotter-than-expected print could trigger a rally in US yields and reinforce expectations of delayed easing. Conversely, a lighter read could reset expectations toward September or later cuts.
GBPUSD H4 Timeframe
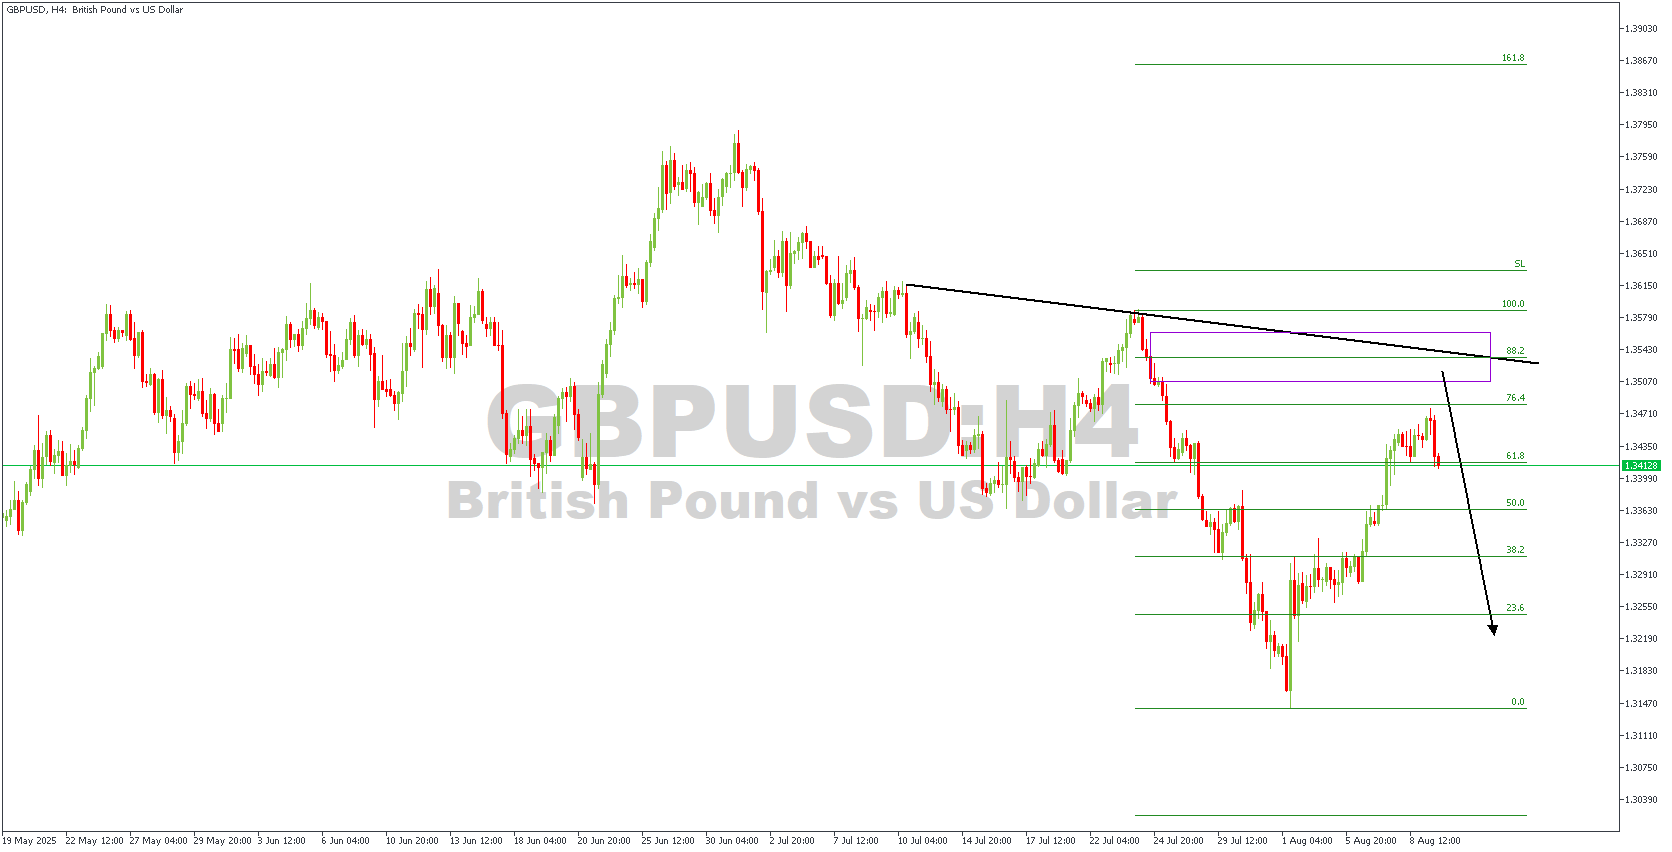
On this GBPUSD 4-hour chart:
Price has been in a sustained downtrend, marked by lower highs and lower lows. The descending trendline is acting as dynamic resistance.
After hitting a major low near 1.3140, price retraced upward, breaking above the 50% Fibonacci level but finding sellers around the 61.8% retracement, just beneath the 76.4% zone and well below the key 88.2%–100% supply area (highlighted in purple).
Currently, price shows rejection candles at the 61.8% Fibonacci level, hinting at potential bearish momentum returning. If sellers take control, the path of least resistance appears to be to the downside, with a projected move toward the 23.6% Fibonacci level as the first target, and possibly retesting the 0% Fib low near 1.3140 if momentum accelerates.
Key Confluences for the Bearish Bias:
- Downtrend structure remains intact.
- Price rejection at a Fibonacci resistance zone.
- The overhead descending trendline reinforces the bearish scenario.
EURUSD H4 Timeframe
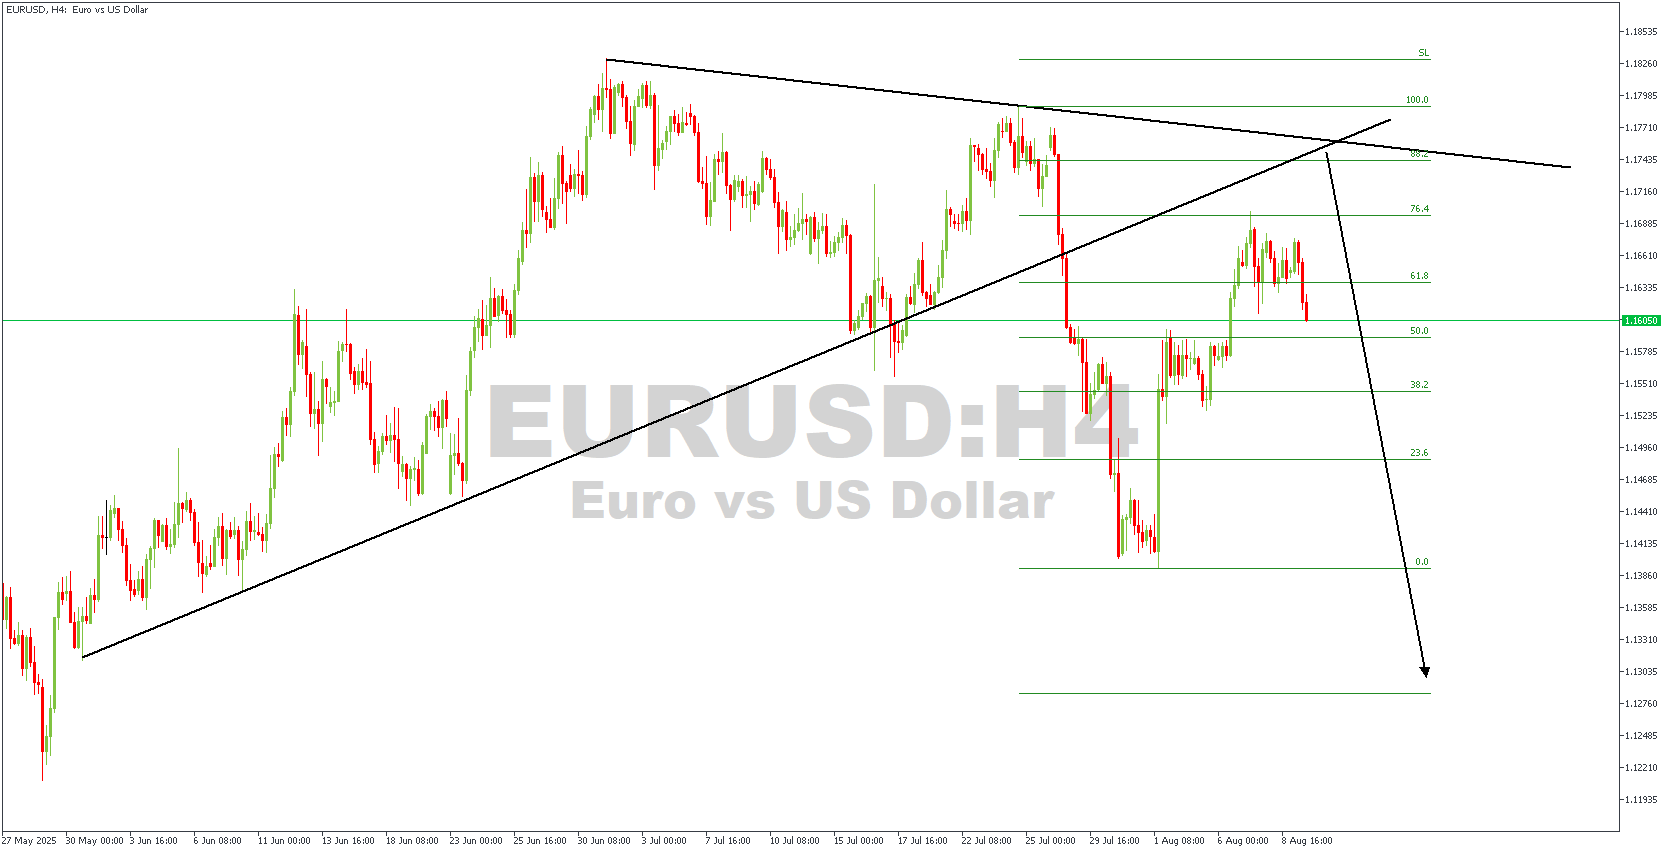
On this EURUSD 4-hour chart:
Price had been in a steady uptrend, supported by a rising trendline and a consistent sequence of higher and lower lows. However, this bullish structure was decisively broken when price collapsed below the ascending trendline, signaling a shift in market momentum.
Following the breakdown, price retraced upward into a resistance zone aligned with the 61.8%–78.6% Fibonacci retracement levels and a descending trendline overhead — a confluence that often attracts sellers in a bearish environment. The rejection from this area has left price trading near the 50% Fibonacci level, with sellers showing renewed pressure.
Currently, the structure suggests a potential bearish continuation pattern, with the black arrow projecting a move toward the previous swing low around 1.1300, corresponding with the 0% Fibonacci level.
Direction: Bearish
Target- 1.14849
Invalidation- 1.17946
CONCLUSION
You can access more trade ideas and prompt market updates on the Telegram channel.


