
AUDCHF – H2 Timeframe
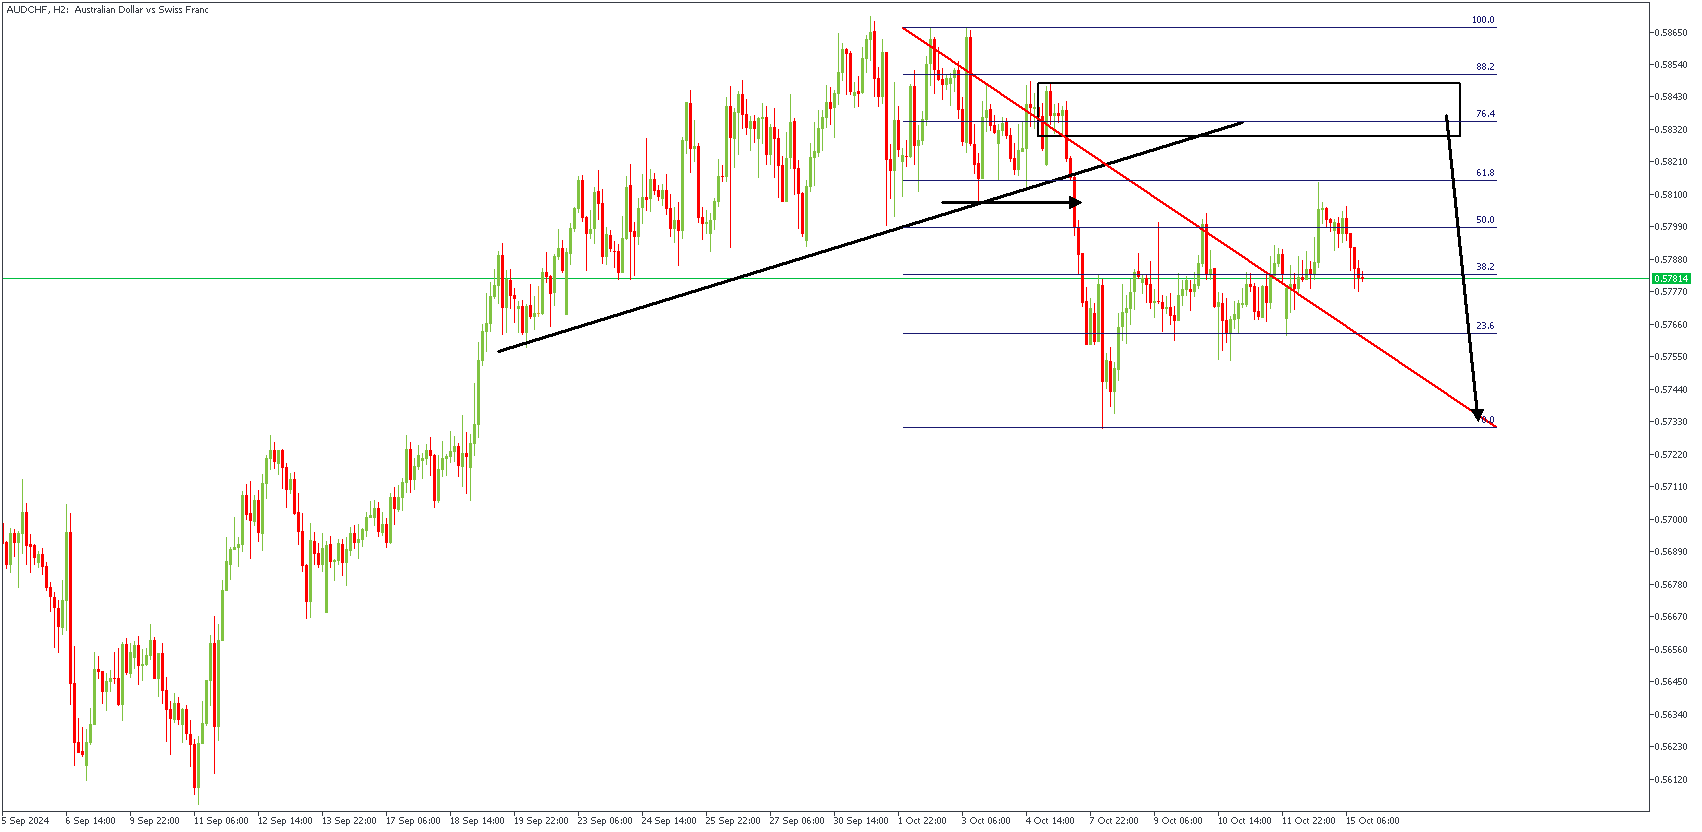
The 2-hour timeframe chart of AUDCHF shows a clear break-of-structure, break-of-trendline pattern. The trendline support was broken, as well as the previous structural low. Combining these with the Fibonacci retracement, we can expect an entry around the 76% of the Fibonacci retracement level based on;
• The break below the previous structural low;
• Retest of the trendline resistance;
• Rally-base-drop supply zone at the confluence of the trendline and Fibonacci levels;
• 76% of the Fibonacci retracement.
Analyst’s Expectations:
Direction: Bearish
Target: 0.57355
Invalidation: 0.58703
