• Sept 16, 2024
  • Trade ideas

US500: Ascending Triangle

US500, Daily

US500Daily.png

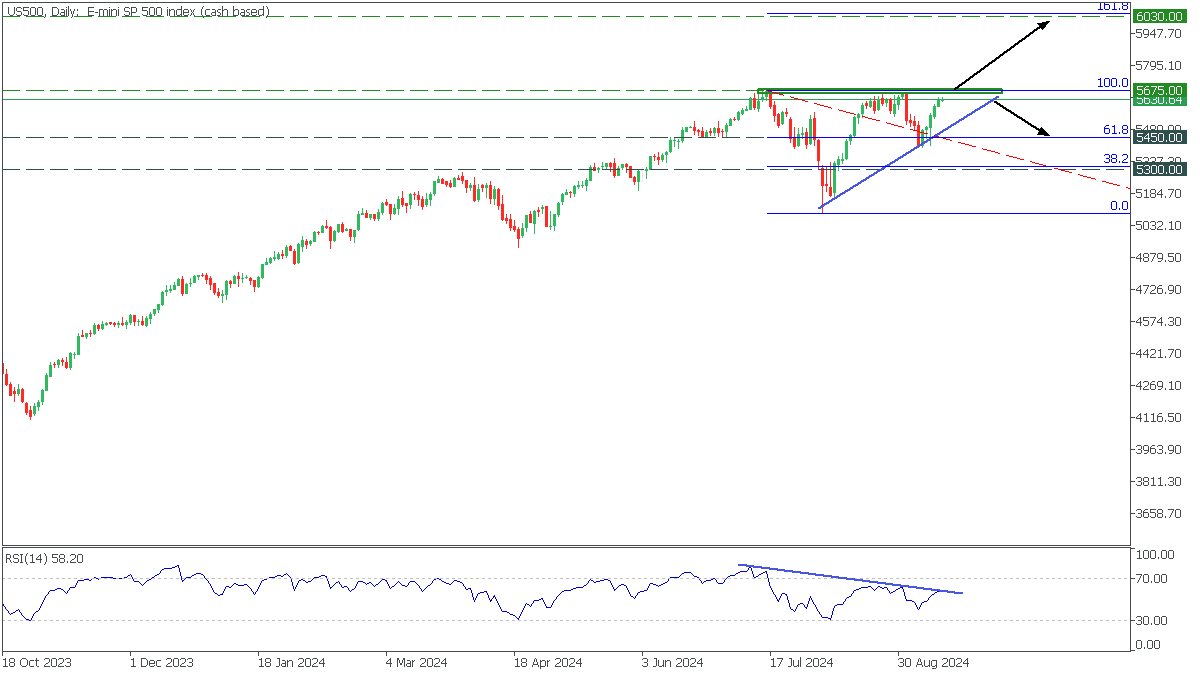
In the Daily timeframe, the US500 has formed an ascending triangle pattern in a long-term bullish trend. The price reached ATH, testing the triangle's upper boundary, but a divergence formed on the RSI.

  • If the price breaks the resistance of 5675, it will open the way to 6030, corresponding to 161.8 Fibonacci;
  • A break of the lower trendline will drop the US500 to 5450 support;
TRY TRADING NOW

Trading foreign currencies on margin involves significant risks and may not be suitable for everyone, as high leverage can increase both potential gains and losses. Before entering the foreign exchange market, it is essential to evaluate your investment goals, personal experience, and risk tolerance.

Share with friends:

Photo

Author: Egor Schmidt